.png)

Engineering analytics is the practice of analyzing data from the software development pipeline to understand and improve software delivery performance. It connects fragmented data points across issue trackers and code repositories to give leaders systemic visibility.
The goal is to move beyond simply measuring output and start governing the entire delivery system. This continuous evaluation of engineering metrics helps organizations identify bottlenecks and align daily work with strategic business outcomes.
Search results often mix these two distinct concepts. Analytics engineering is a specific job title within the modern data stack. These professionals build and maintain the data pipelines that data scientists use for business intelligence.
Engineering analytics is an operational discipline used by technical executives. VPs of Engineering and CTOs use this discipline to monitor workflow bottlenecks and maintain delivery predictability.
Imagine staring at a dashboard on Friday afternoon during a critical delivery cycle. Deployment frequency looks healthy, yet lead time for changes has doubled. Your engineering managers spent hours dealing with manual reporting overhead to build this view, but the dashboard can't explain the root cause of the delay.
This highlights the fundamental problem with passive reporting. Dashboards give you metrics without context. They show a snapshot of past performance but offer zero actionable insights to resolve the workflow friction. Analytics requires an operational intelligence layer to interpret those signals and guide your response.
Understanding the evolution of data maturity helps clarify why dashboards fall short. The industry breaks analytics into four operational stages.
AI coding tools are fundamentally changing how work is produced. They accelerate initial output, so developers ship more volume in less time. Traditional developer productivity frameworks look at this spike in velocity and assume the system is highly efficient.
But this volume introduces massive hidden complexity. The difference between AI-generated code vs. human-written code often shows up during the review phase. An AI tool might write a feature in ten minutes, but that high-complexity pull request can sit in review for four days. Human reviewers struggle to validate the dense logic, creating severe workflow friction.
The deployment metrics look temporarily inflated, yet technical debt quietly accumulates in the background. The delivery system slows down over time as developers spend hours untangling complex PRs instead of writing new features. You can't manage this new reality with basic dashboards because they measure the speed of creation while completely missing the downstream cost of code review.
The core issue is no longer a lack of visibility. Jira and GitHub provide enough raw data to achieve system-level visibility, yet engineering leaders still lack objective understanding. You need a reliable way to turn conflicting metrics into clear execution decisions without relying on manual analysis or guesswork.
TargetBoard is an agentic operational intelligence platform that connects data across company systems, interprets performance continuously, and uses domain-expert AI agents to guide execution decisions. It automatically interprets fragmented data across your tools to uncover hidden issues like PR churn.
This intelligence layer surfaces decision-ready insights for leaders. You can restore delivery predictability and identify bottlenecks objectively, allowing your teams to stop reacting to stale reports and start addressing workflow friction as it happens.
VPs of Engineering mistakenly treat deployment metrics as a complete measure of developer productivity rather than just a starting signal. According to the 2023 DORA report, elite performing teams prioritize delivery predictability and system reliability alongside raw speed. Frameworks like DORA metrics and the SPACE framework provide valuable benchmarks for these outcomes.
But these frameworks don't provide systemic understanding. They tell you that a metric shifted, yet they can't isolate the root cause behind the shift. You need an active intelligence layer to connect those framework signals to actual workflow behavior.
Real execution decisions happen when you connect data to specific workflow bottlenecks. Consider a sprint where cycle time spikes by 40 percent. A basic dashboard simply reports the delay, but operational intelligence reveals the actual mechanics.
According to 2023 industry benchmarks from LinearB, pull request review time accounts for 70 percent of delivery delays. In this scenario, three high-complexity pull requests sat in review for over four days due to cross-team dependencies, directly causing that 40 percent cycle time spike. Identifying pull request (PR) churn at this granular level allows you to reallocate senior engineers to clear the backlog immediately.
Selecting the right platform requires evaluating how well it moves your organization from reactive reporting to proactive governance. Modern engineering analytics systems and engineering analytics tools fall into three primary categories. You need a unified source of truth to manage complex delivery pipelines effectively.
Relying on output metrics alone creates a false sense of security, especially when AI tools inflate short-term velocity. True organizational improvement requires understanding how work flows through your entire delivery pipeline. Shifting from passive dashboards to operational intelligence gives you the context needed to drive execution alignment.
Understanding these patterns gives you a clear framework for your next resource allocation decision. You can stop reacting to delayed reports and start managing delivery predictability proactively.

.png)
Lead time for changes is the amount of time it takes a commit to get into production. As a core DORA metric used to evaluate software delivery performance and CI/CD pipeline efficiency, it tracks three specific phases:
That's the mathematical calculation, but the operational reality is very different. When you track change lead time, you aren't actually measuring developer productivity or how fast your team types. You're measuring how long your code sits still. A high lead time signals deep workflow friction across your teams, exposing the hidden waiting states in your delivery process.
Code spends the vast majority of its lifecycle waiting for a human to review it or coordinate its release. If your lead time to deploy is increasing, your organization is suffering from review congestion and organizational friction. The bottleneck is your queueing system, so you have to look at your waiting states to find the real problem.
Engineering leaders often see conflicting signals across disconnected systems because teams use these terms interchangeably. You need precise boundaries to diagnose where work actually gets stuck.
If your cycle time is stable but your DORA metric is expanding, your developers are not the problem. Your deployment coordination and review queues are failing to keep up with the output.
The DORA research program provides clear benchmarks for this metric, categorizing software delivery performance into four tiers:
These benchmarks are useful for setting a baseline, but they don't tell you how to improve. Traditional engineering organizations try to hit the elite tier by pushing developers to work faster. This approach completely ignores how flow systems actually behave.
Elite teams don't type faster. They systematically reduce waiting queues through batch size reduction and automated testing. They understand that a large queue size directly predicts a delivery predictability collapse.
When you push more code into a congested system, you don't get faster delivery. You get massive PR saturation. The code sits in review queues for days, forcing developers to context-switch to new tasks. This destroys momentum and inflates your metrics. Achieving elite performance requires you to manage your bottlenecks and reduce handoff friction, so you must focus on your coordination capacity rather than your raw coding speed.
When looking at a slow pipeline, executives assume developers are struggling with technical problems. The reality is that code spends most of its life in waiting systems. Systemic bottlenecks rarely happen during active development. They happen when work stops moving and enters workflow queues. A high lead time is a symptom of organizational friction, so you have to look at the spaces between your developers to find the real delays.
Every time a piece of code changes hands, it loses momentum. This handoff friction is a primary driver of expanding lead times. A developer finishes a feature and requests a review, but the reviewer is busy with their own sprint commitments. The code sits idle, which introduces coordination latency into the system.
These process bottlenecks compound across teams. Queueing-system dynamics dictate that as utilization approaches 100 percent, wait times increase exponentially. Pushing your teams to maximum capacity actually creates deployment coordination failures and slows everything down.
Artificial intelligence coding assistants have fundamentally changed how work is produced. Developers can now generate massive amounts of code in minutes. But this surge in artificial intelligence code generation creates a dangerous trap. The raw output increases, yet the human capacity to verify that code remains exactly the same.
This imbalance leads directly to review saturation. Complex pull requests (PRs) stack up, extending the code review cycle by days. Reviewers struggle to untangle the sudden influx of code complexity, so they delay the review or rubber-stamp it.
This review congestion forces developers to context-switch while waiting for approvals. That destroys efficiency, inflates your lead time, and ultimately worsens your time to restore service / MTTR when bad code slips through.
Tracking DORA metrics gives you a trailing signal of your performance. But metrics alone cannot explain why performance is changing. When executives rely on manual reporting, they waste hours aggregating fragmented data from Jira and GitHub. The numbers often conflict, which erodes trust in the data and creates massive engineering overhead. A high lead time signals deep workflow friction across your teams.
To actually solve these delays, you have to understand the bottleneck economics of your delivery pipeline. You need a single source of truth that connects disconnected systems and exposes hidden waiting states. This is why engineering leaders are moving away from passive manual reporting and shifting toward operational intelligence, enabling true data-driven decision making.
You can't solve a delivery slowdown by forcing your team to write code faster. Software delivery is fundamentally constrained by human coordination capacity. According to the foundational Accelerate research, organizations must optimize the entire value stream. As AI accelerates code generation, it pushes organizations up against strict human verification limits. If your review queues can't handle the volume, your lead time to deploy will inevitably increase.
Ignoring queueing-system dynamics creates severe maintainability risks. Code that sits in congested pipelines degrades in quality, and developers lose the context needed to fix it, leading to a massive accumulation of technical debt. Restoring predictability requires you to manage your workflow queues actively. You must align your output with your capacity to review, verify, and coordinate that work.

Software development performance metrics are operational signals that measure how efficiently a team delivers code to production. The industry standard baseline relies on the four core DevOps Research and Assessment metrics. These engineering Key Performance Indicators divide performance into speed and stability.
VPs of Engineering often fall into a scoreboard mentality when tracking these numbers. They spend hours manually aggregating point-in-time reports, treating the metrics as the final goal rather than a diagnostic signal. Improving these software delivery performance metrics requires understanding the workflow friction beneath the numbers. Frameworks provide signals, so they don't provide full understanding on their own. You must connect these signals to actual execution decisions to improve delivery predictability.
Problem: Teams ship features slowly and can't pinpoint where work gets stuck in the pipeline.
Solution: Measure cycle time to identify bottlenecks in the review and deployment phases.
Artificial intelligence code generation fundamentally changes how software is built. Tools like Copilot and Cursor allow developers to write thousands of lines of code in minutes. And this massive increase in raw throughput completely breaks traditional software developer productivity metrics.
You look at your dashboards and see record-high commit volumes. The metrics suggest the team is moving faster than ever, yet overall delivery predictability drops. This happens because increased output actively masks hidden complexity. AI tools generate code quickly, but that code often lacks systemic context. The resulting codebase becomes brittle, and the organization accumulates technical debt faster than human developers can refactor it.
Quantitative data only tells half the story, so engineering leaders must also track qualitative metrics to understand the reality on the ground. Frameworks like the SPACE framework provide a more balanced view by combining qualitative and quantitative data. This approach prevents leaders from optimizing a system to the point of breaking the people running it.
You can't measure system health without measuring Developer Experience. High workflow friction directly degrades how developers feel about their work. When developers constantly fight broken pipelines or wait days for code reviews, their satisfaction plummets and delivery slows down.
Problem: Teams take on too many tasks at once, so context switching destroys their focus and stalls delivery.
Solution: Implement work in progress limits to force completion before starting new tasks and increase delivery confidence.
Enterprise engineering teams still rely on outdated measurement tactics that incentivize the wrong behaviors. Measuring the wrong things creates a toxic culture and actively hides systemic risks.
Tracking lines of code is the fastest way to destroy developer effectiveness. This metric was always flawed, but Artificial Intelligence makes it actively dangerous. AI tools can generate thousands of lines of boilerplate code in seconds. If you measure volume, your metrics will look incredible while your codebase becomes an unmaintainable mess. You need to measure the value delivered to the customer instead of the raw output.
Software development is a complex team operation. Tracking team performance vs. individual performance is a critical distinction. Pitting developers against each other creates a toxic environment where senior engineers refuse to help juniors. If a lead engineer spends all week reviewing pull requests, their individual commit metrics will drop. Yet their work is exactly what keeps the entire system moving. You must measure how the team delivers as a unified unit.
Executives often demand faster delivery without understanding the speed vs. quality tradeoffs. Pushing teams to ship faster without investing in automated testing leads to a massive spike in production failures. The system will eventually grind to a halt under the weight of its own technical debt. True predictability requires balancing feature development with continuous system maintenance.
Dashboard fatigue is a very real problem for modern engineering leaders. You have a Jira dashboard for issue tracking and a GitHub dashboard for pull requests. These Jira and GitHub data silos provide conflicting signals. Jira says the sprint was successful, but GitHub shows massive code review churn.
This disconnect forces leaders to rely on intuition rather than data. You can't make confident execution decisions when your tools refuse to talk to each other. Dashboards are static scoreboards that show you what happened yesterday. They don't tell you why it happened or what you should do about it today.
TargetBoard is an agentic operational intelligence platform that helps leadership teams understand how execution is performing, why it is changing, and how to respond. It unifies performance data across systems into a trusted model and deploys domain-expert AI agents to translate insights into decision-ready inputs that guide execution.
Tracking software development performance metrics isn't the end goal. The goal is to build a reliable delivery system that consistently drives business outcomes. Staring at a static scoreboard won't help you identify the hidden complexity introduced by Artificial Intelligence or the workflow friction slowing down your senior engineers.
You must shift your focus from measuring isolated outputs to understanding your interconnected systems. This systemic visibility gives you a clear framework for your next resource allocation discussion or board meeting. It replaces guesswork with actual delivery predictability. Take a hard look at your current reporting structure and ask yourself if your data actually helps you make better execution decisions, because visibility without action is just overhead. If it just gives you another number to report, it's time to upgrade your operational intelligence.
Development cycle time is the total amount of time it takes for an engineering team to complete a single task from the moment work begins until it is deployed to production.
This metric originated in Lean manufacturing to measure inventory flow. Today it serves as a critical diagnostic signal for software development cycle time. Traditional engineering leaders often make the mistake of treating this as a pure speed metric. I have watched organizations gamify cycle time to push developers to type faster. That approach inevitably leads to developer burnout and lower quality code. A low cycle time means nothing if the code requires massive rework later.
You must view development cycle time as a measure of system flow and cross-team friction. It tells you exactly where work stalls. Tracking this accurately is the only way to ensure delivery predictability across your entire engineering organization.
The difference between cycle time and lead time comes down to when the clock starts. Lead time begins the moment a customer requests a feature, while cycle time begins the moment a developer actually starts writing code for that feature.
Lead time for changes measures your entire product management and prioritization process. Software cycle time isolates the engineering execution phase. You need both to understand your true time to market.
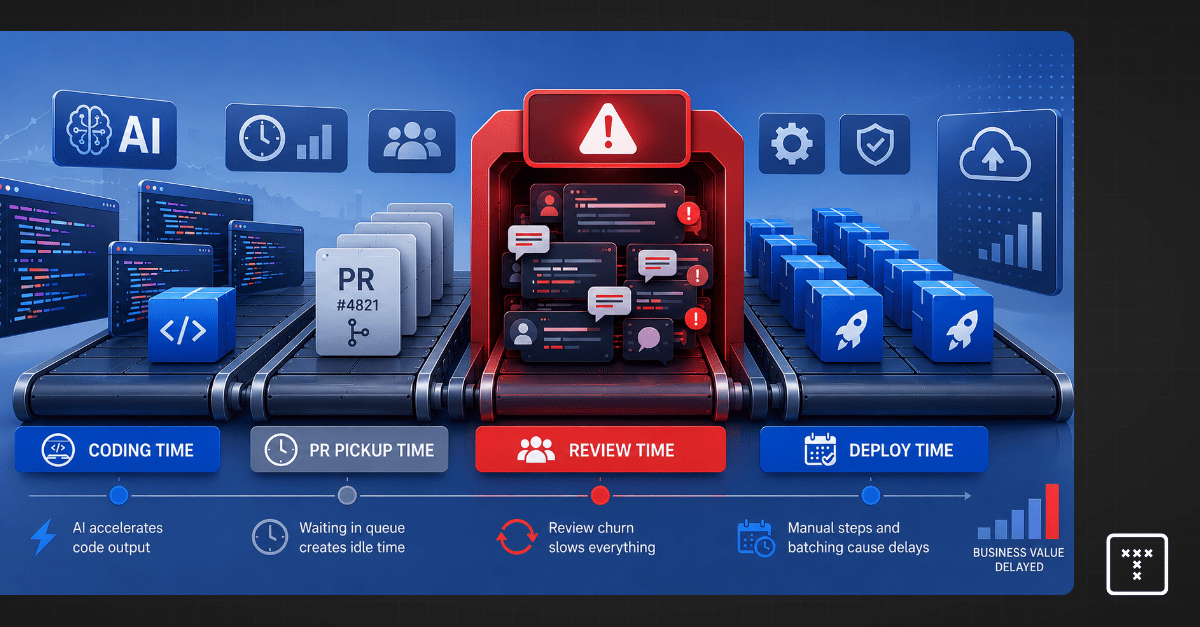
You can't fix a bottleneck until you know exactly where it lives. The cycle time formula breaks down into four distinct phases. Tracking the transition between these phases reveals where your system loses momentum.
Coding time measures the lifespan from the developer's first commit to the moment they issue a pull request. This phase tracks active creation. AI tools have drastically reduced coding time across the industry.
PR pickup time tracks the idle period between a developer opening a pull request and a peer beginning the review. That's rarely a skill issue. It's almost always a coordination and visibility problem.
Review time measures the span from the first review comment to the final approval. That's the most common bottleneck in modern software delivery. Fast coding times often hide severe inefficiencies here, as reviewers struggle to understand massive blocks of undocumented code.
Deploy time covers the final span from a code merger to a production release. Heavy manual testing requirements and complex release train schedules often inflate this metric, leaving finished code sitting idle.
To measure development cycle time accurately, you must connect your issue tracking software to your version control system to track the exact timestamps of commits, pull requests, reviews, and deployments.
Relying solely on DORA metrics or isolated Jira boards gives you an incomplete picture. DORA metrics provide useful signals for deployment frequency and stability, but they do not provide system-level visibility into why a specific workflow is stalling. Fragmented tools make measurement incredibly difficult. Jira says a ticket is in progress, but GitHub shows the code has been sitting in review for four days. You can't manually merge this data to calculate accurate sprint velocity. You need a unified operational model to see the truth.
You must standardize your data inputs before you can diagnose your delivery pipelines. Follow these steps to build a reliable measurement foundation.
Connecting these steps gives you actionable insights to improve workflow efficiency and continuous delivery.
When you push teams to just code faster, you fall into the local optimization trap. A local optimization improves one small part of the process while degrading the whole system. Forcing engineers to close tickets rapidly often leads to sloppy commits, so you see a massive spike in rework and code churn during the review phase. This creates a severe downstream delivery impact. You must measure system flow outcomes rather than isolated speed metrics to protect your delivery timelines.
I see this constantly with modern engineering teams. You roll out AI coding assistants, and coding time drops to near zero. Developers produce massive blocks of code in minutes. Management often views these tools purely as cycle time accelerators, but they fail to account for the resulting review churn.
AI-assisted developers write code up to 50% faster, yet PR cycle times often increase due to the cognitive load placed on reviewers.¹ AI-generated code introduces hidden complexity, so reviewers have to spend hours untangling logic they didn't write. This creates a massive delivery bottleneck and severe maintainability risks. You accelerated the easiest part of the job while gridlocking the hardest part.
Engineering leaders often mandate a smaller pull request size to speed up reviews. This sounds logical in theory. In reality, forcing developers to break a single feature into ten tiny PRs creates a coordination nightmare. Reviewers lose the broader context, so defect patterns increase during integration. That's especially true when working with highly complex, interdependent legacy codebases that skew standard benchmarks.
Your agile cycle time might look great on a dashboard, but your actual system flow grinds to a halt. You must enforce strict Work In Progress (WIP) limits to balance batch size with the cognitive load required to review the entire feature.
True optimization comes from lean manufacturing principles. You don't ask the assembly line workers to move their hands faster. You eliminate the wait time and idle time between stations.
In software delivery, this means reducing handoffs and automating your deployment frequency. You want work to flow continuously without sitting in a queue waiting for manual intervention. Elite performers achieve high deployment frequency by minimizing handoffs rather than pushing individual engineers to type faster.²
Use this framework to find the root cause of your delivery delays and fix your workflow coordination.
Having a dashboard that tells you your cycle time is nine days doesn't help you fix it. Passive metrics require you to guess what went wrong. You need operational intelligence to explain why performance is changing. This requires shifting from basic executive reporting to an agentic system that understands delivery trade-offs and system flow.
TargetBoard is an agentic operational intelligence platform that helps leadership teams understand how execution is performing, why it's changing, and how to respond. TargetBoard deploys domain-expert AI agents across your connected systems to act as expert analysts. Instead of just showing a red line on a graph, TargetBoard explains that cycle time spiked because AI-generated code in a specific repository caused a 40% increase in review churn. It translates raw data into objective signals you can use to make immediate resource decisions.
Pushing for speed without predictability is an organizational failure. Keep in mind that no single metric provides a complete picture of engineering health. True engineering velocity requires reliable system flow. When you stop treating development cycle time as a stopwatch and start treating it as a diagnostic signal, you regain delivery predictability. Understanding these patterns gives you a clear framework to align your engineering execution with your business goals and confidently forecast your next major release.

.webp)