Development cycle time is the total amount of time it takes for an engineering team to complete a single task from the moment work begins until it is deployed to production.
This metric originated in Lean manufacturing to measure inventory flow. Today it serves as a critical diagnostic signal for software development cycle time. Traditional engineering leaders often make the mistake of treating this as a pure speed metric. I have watched organizations gamify cycle time to push developers to type faster. That approach inevitably leads to developer burnout and lower quality code. A low cycle time means nothing if the code requires massive rework later.
You must view development cycle time as a measure of system flow and cross-team friction. It tells you exactly where work stalls. Tracking this accurately is the only way to ensure delivery predictability across your entire engineering organization.
The difference between cycle time and lead time comes down to when the clock starts. Lead time begins the moment a customer requests a feature, while cycle time begins the moment a developer actually starts writing code for that feature.
Lead time for changes measures your entire product management and prioritization process. Software cycle time isolates the engineering execution phase. You need both to understand your true time to market.
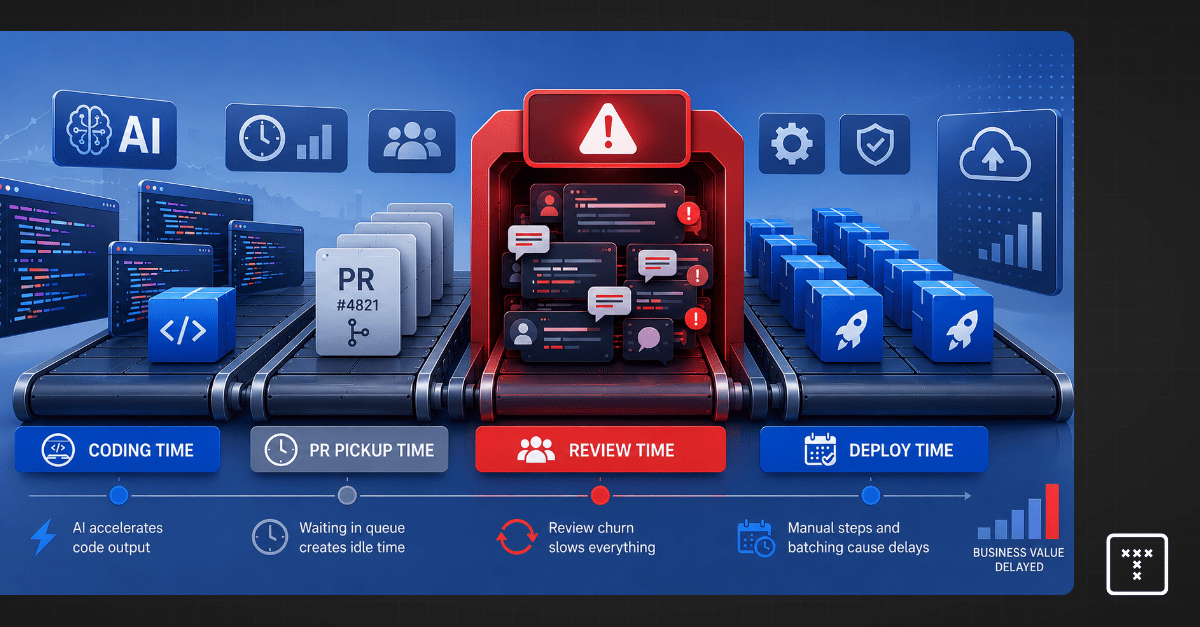
You can't fix a bottleneck until you know exactly where it lives. The cycle time formula breaks down into four distinct phases. Tracking the transition between these phases reveals where your system loses momentum.
Coding time measures the lifespan from the developer's first commit to the moment they issue a pull request. This phase tracks active creation. AI tools have drastically reduced coding time across the industry.
PR pickup time tracks the idle period between a developer opening a pull request and a peer beginning the review. That's rarely a skill issue. It's almost always a coordination and visibility problem.
Review time measures the span from the first review comment to the final approval. That's the most common bottleneck in modern software delivery. Fast coding times often hide severe inefficiencies here, as reviewers struggle to understand massive blocks of undocumented code.
Deploy time covers the final span from a code merger to a production release. Heavy manual testing requirements and complex release train schedules often inflate this metric, leaving finished code sitting idle.
To measure development cycle time accurately, you must connect your issue tracking software to your version control system to track the exact timestamps of commits, pull requests, reviews, and deployments.
Relying solely on DORA metrics or isolated Jira boards gives you an incomplete picture. DORA metrics provide useful signals for deployment frequency and stability, but they do not provide system-level visibility into why a specific workflow is stalling. Fragmented tools make measurement incredibly difficult. Jira says a ticket is in progress, but GitHub shows the code has been sitting in review for four days. You can't manually merge this data to calculate accurate sprint velocity. You need a unified operational model to see the truth.
You must standardize your data inputs before you can diagnose your delivery pipelines. Follow these steps to build a reliable measurement foundation.
Connecting these steps gives you actionable insights to improve workflow efficiency and continuous delivery.
When you push teams to just code faster, you fall into the local optimization trap. A local optimization improves one small part of the process while degrading the whole system. Forcing engineers to close tickets rapidly often leads to sloppy commits, so you see a massive spike in rework and code churn during the review phase. This creates a severe downstream delivery impact. You must measure system flow outcomes rather than isolated speed metrics to protect your delivery timelines.
I see this constantly with modern engineering teams. You roll out AI coding assistants, and coding time drops to near zero. Developers produce massive blocks of code in minutes. Management often views these tools purely as cycle time accelerators, but they fail to account for the resulting review churn.
AI-assisted developers write code up to 50% faster, yet PR cycle times often increase due to the cognitive load placed on reviewers.¹ AI-generated code introduces hidden complexity, so reviewers have to spend hours untangling logic they didn't write. This creates a massive delivery bottleneck and severe maintainability risks. You accelerated the easiest part of the job while gridlocking the hardest part.
Engineering leaders often mandate a smaller pull request size to speed up reviews. This sounds logical in theory. In reality, forcing developers to break a single feature into ten tiny PRs creates a coordination nightmare. Reviewers lose the broader context, so defect patterns increase during integration. That's especially true when working with highly complex, interdependent legacy codebases that skew standard benchmarks.
Your agile cycle time might look great on a dashboard, but your actual system flow grinds to a halt. You must enforce strict Work In Progress (WIP) limits to balance batch size with the cognitive load required to review the entire feature.
True optimization comes from lean manufacturing principles. You don't ask the assembly line workers to move their hands faster. You eliminate the wait time and idle time between stations.
In software delivery, this means reducing handoffs and automating your deployment frequency. You want work to flow continuously without sitting in a queue waiting for manual intervention. Elite performers achieve high deployment frequency by minimizing handoffs rather than pushing individual engineers to type faster.²
Use this framework to find the root cause of your delivery delays and fix your workflow coordination.
Having a dashboard that tells you your cycle time is nine days doesn't help you fix it. Passive metrics require you to guess what went wrong. You need operational intelligence to explain why performance is changing. This requires shifting from basic executive reporting to an agentic system that understands delivery trade-offs and system flow.
TargetBoard is an agentic operational intelligence platform that helps leadership teams understand how execution is performing, why it's changing, and how to respond. TargetBoard deploys domain-expert AI agents across your connected systems to act as expert analysts. Instead of just showing a red line on a graph, TargetBoard explains that cycle time spiked because AI-generated code in a specific repository caused a 40% increase in review churn. It translates raw data into objective signals you can use to make immediate resource decisions.
Pushing for speed without predictability is an organizational failure. Keep in mind that no single metric provides a complete picture of engineering health. True engineering velocity requires reliable system flow. When you stop treating development cycle time as a stopwatch and start treating it as a diagnostic signal, you regain delivery predictability. Understanding these patterns gives you a clear framework to align your engineering execution with your business goals and confidently forecast your next major release.

In the dynamic landscape of technology startups, the reliance on external outsourcing, offshore teams, or agency support is increasingly common. Whether it's for development, product management, QA, IT, support, or marketing, these partnerships can be pivotal. However, aligning the interests of your company with those of your service providers is a nuanced challenge. This article explores the importance of tracking partner performance and how TargetBoard simplifies this crucial task.
Tech startups often turn to external talent for several reasons:
1. Talent Acquisition Challenges: Finding the right talent locally can be tough, prompting companies to look beyond their borders.
2. Cost Reduction: Outsourcing can be a cost-effective solution compared to local hiring.
3. Rapid Scaling: Startups needing to grow quickly often find that external teams provide the necessary bandwidth.
4. Organizational Diversity and Liquidity: Bringing in external teams can introduce fresh perspectives and flexible structures.
Despite the benefits, a significant challenge remains: aligning your company's interests with those of your service providers. Often, these providers are driven by their own goals, primarily maximizing profit, which can sometimes conflict with the needs of their clients.
- A development agency might prioritize quick delivery over quality, leading to technical debt.
- A marketing firm could focus on short-term gains instead of building a sustainable brand strategy.
- IT support services might offer solutions that require constant maintenance, ensuring ongoing dependency and revenue.- An implementation specialist as a premium partner for a major CRM or Cloud might elect to implement a costly or overkill solution.
Keeping tabs on the performance of your partners is not just beneficial; it's essential. It fosters honest conversations, enables better evaluation and planning, and allows for a comparative analysis of various providers. Unfortunately, many companies lack the tools and systems to effectively monitor this performance.
TargetBoard revolutionizes how tech startups can manage and evaluate their external partnerships. With its user-friendly interface and comprehensive metrics, TargetBoard offers a seamless solution for comparing partners, consultants, and agencies against each other and even against your in-house teams.
Effective project management is crucial, especially for tech startups in their growth stage. Despite its importance, many companies overlook this aspect, often entrusting product or development managers with the task without specialized support. This approach, however, overlooks the complexities involved in tracking Key Performance Indicators (KPIs) of a project.
KPIs are essential for measuring the success and efficiency of a project. However, tracking these metrics can be challenging. Data availability, accuracy, and timeliness are common issues. Moreover, companies often recognize the need for KPI tracking after a project has already commenced, leading to retroactive planning and data collection.
A significant consequence of not tracking project KPIs effectively is the lack of visibility into a project's progress. This opacity creates friction among management team members and leads to a considerable waste of time. Managers often find themselves in a constant hustle to compile and present KPIs ad-hoc, multiple times a day. This process not only consumes valuable time but also impedes efficient communication within the team.
In the realm of project management, several KPIs are crucial for monitoring progress and success. These include:
1. Project Completion Rate: Measures the percentage of projects completed within the stipulated timeframe.
2. Budget Variance: Tracks the difference between the budgeted and actual cost of the project.
3. Scope Creep: Monitors any changes or expansions in project scope beyond the original plan.
4. Resource Utilization: Assesses how efficiently resources (both human and material) are used.
5. Milestone Achievement: Tracks the completion of key stages within the project timeline.6. Team Performance: Evaluates the productivity and efficiency of the team members.
Managing multiple projects adds further complexity. Each project may have different KPIs and tracking requirements, making a unified system like TargetBoard essential for coherent and efficient management.
TargetBoard simplifies the process of tracking these KPIs. It integrates seamlessly with existing systems, providing immediate and hassle-free access to essential project metrics. This accessibility is crucial for making informed decisions and keeping projects on track.
TargetBoard is designed to be adaptable. It can be used at any stage of a project, allowing for retroactive data filling and redefining project scopes based on accurate, up-to-date information.Tracking KPIs is a fundamental part of successful project management. TargetBoard offers a streamlined, comprehensive solution, ensuring that project managers have the data they need to guide their projects to successful completion. This tool is indispensable for companies aiming to enhance their project management capabilities and achieve better outcomes.
Startups, in many ways, mirror the journey of living organisms. From inception to maturity, both tread a challenging path, with pitfalls and hazards lurking at every turn. However, by understanding these challenges, startups can better navigate this perilous journey. This article, inspired by the world of biology, seeks to offer a deeper understanding of why startups fail and how they can avoid these pitfalls.
The trials and tribulations of startups are manifold. While numerous studies and articles have outlined various reasons for failure, some stand out more than others:
- Lack of Market Need: Imagine a fish evolving to live on land, only to find out there's no food for it there. Startups, in a similar vein, can develop a product that, while innovative, doesn't cater to any significant market need, leading to its eventual downfall.
- Running Out of Cash: Just as a plant needs water to grow, startups need cash flow to expand and thrive. Without sufficient funds, even the most promising of startups can wilt and die.
- Not the Right Team: Think of this as a beehive where the bees don't cooperate. A disjointed team that lacks the necessary skills or passion can hinder a startup's growth trajectory.
- Competition: In nature, predators can lead to an organism's end. In the business world, competitors, if too dominant or numerous, can outpace and overshadow a budding startup.
1. Miscarriage: Like an embryo that fails to develop, some startups don't make it past the initial stages. They might have a promising idea but fall short in execution. For example, many startups set out with the idea of creating the "next Facebook," but without a unique value proposition or clear strategy, they never move past the conceptual stage.
2. Trauma: Sudden, traumatic events can derail a startup's growth. Imagine a young tree hit by lightning. It's unexpected and can be devastating. A startup might face a sudden exodus of its core team or see a competitor launch a product that's leagues ahead. Blockbuster, for example, was blindsided by the rise of digital streaming services like Netflix, leading to its decline.
3. Chronic Disease: Lingering issues within a startup can be likened to a chronic ailment. A classic case is MoviePass, which offered an unsustainable subscription model. Their high customer acquisition costs, coupled with an unviable business strategy, gradually led to their downfall.
4. Old Age: All organisms have a life cycle, and so do businesses. Kodak, once a giant in the world of photography, struggled to adapt to the digital age, leading to its decline.
5. Toxins: Toxic behaviors and cultural norms can poison a startup from within. Think of it as an organism exposed to harmful substances. For a startup, this can manifest as unethical practices, discriminatory behaviors, or a lack of transparency. The ride-hailing service Uber faced significant backlash due to allegations of a toxic work environment, which had substantial repercussions for the company.
Yet, startups aren't destined for failure. With the right tools and mindset, many of these challenges can be mitigated. TargetBoard stands as a beacon for startups. By ensuring that all departments and team members are on the same page, working towards unified objectives, startups can steer clear of these common pitfalls. In the dynamic world of business, as in nature, the ability to adapt and evolve is paramount.
In conclusion, the interplay of various factors determines the success or failure of a startup. By understanding these factors, and with a touch of foresight and the right tools, startups can not only survive but thrive in the business ecosystem.

.webp)