.png)
Operational waste is the non-product output generated during daily business operations, widely recognized as a silent profit killer that drains time and resources. But for modern software teams, this waste is rarely physical scrap. Instead, it manifests as:
These invisible bottlenecks silently kill true productivity, consuming engineering hours without moving product features forward.
Traditional management frameworks track physical materials and visible process inefficiencies. Modern engineering leaders must track behavioral friction and organizational latency. If you apply manufacturing metrics to digital delivery systems, you will measure output while completely missing system-level visibility.
The reality of your execution pipeline is that waste happens between active work states. Context switching forces developers to abandon deep work to track down missing requirements across fragmented data systems. Review congestion leaves critical pull requests sitting untouched for days.
Handoff friction occurs when silos prevent clear communication between QA, product, and engineering. You might track high team activity across your dashboards, but you still experience slow delivery because waiting systems dominate the cycle.
Artificial intelligence fundamentally changes software development by accelerating code generation. This dramatically increases raw output, but without proper governance it floods your pipeline. This surge introduces hidden complexity and spikes pull request churn across your organization.
Human reviewers can't keep up with the sheer volume of generated code. This creates massive review system inefficiency and severe code review bottlenecks. You end up with more code but slower predictable delivery, so the tool built to increase speed actually compounds your operational waste.
Lean manufacturing defines seven traditional operational wastes, but you must translate these into software delivery equivalents to govern modern teams. Overproduction is no longer excess inventory. It's scope creep and unused materials in your codebase. Defects translate directly to technical debt, and waiting translates to code review bottlenecks.
Industry standard frameworks like DORA metrics and the SPACE framework provide valuable signals for engineering leaders. Tracking deployment frequency and lead time establishes a critical baseline for software delivery performance^1. Similarly, measuring developer activity alongside system reliability provides a broader view of team health^2.
But these only offer lagging indicators of performance. They tell you that a delivery metric shifted, yet they completely fail to explain the root cause.
When your cycle time spikes, a traditional dashboard flags the delay. It doesn't tell you that specific high-complexity pull requests have been sitting in review for days. You see the symptom but miss the workflow friction. To achieve true productivity, you must upgrade your tooling to capture the behavioral context behind the numbers.
Identifying and eliminating workflow friction requires you to move beyond static manual reporting. You have to implement an operational intelligence layer that catches delivery risk exactly when decisions are made. This is where you replace fragmented data silos with system-level understanding.
TargetBoard is an agentic operational intelligence platform that connects data across company systems, interprets performance through operational intelligence, and uses domain-expert artificial intelligence agents to guide execution decisions. These agents continuously analyze performance across GitHub, Jira, and your delivery tools.
This agentic analysis detects review bottlenecks instantly and surfaces delivery risks before they compound into missed milestones. By providing decision-ready inputs directly to your engineering managers, you drastically reduce operational overhead. You shift your entire management posture from reactive intuition to proactive bottleneck identification.
The most successful engineering leaders actively govern their workflows to reduce coordination drag. You must shift your strategy from tracking raw output to managing system-level friction. This allows you to align your teams and prioritize the work that actually drives business value.
When you reduce invisible waiting systems, you can ship faster without accumulating technical debt. This focus on execution alignment ensures you maintain sustainable development across your entire organization. You can finally monitor maintainability trends and catch rework patterns before they destroy your predictable delivery timelines.
.png)
In the dynamic landscape of technology startups, the reliance on external outsourcing, offshore teams, or agency support is increasingly common. Whether it's for development, product management, QA, IT, support, or marketing, these partnerships can be pivotal. However, aligning the interests of your company with those of your service providers is a nuanced challenge. This article explores the importance of tracking partner performance and how TargetBoard simplifies this crucial task.
Tech startups often turn to external talent for several reasons:
1. Talent Acquisition Challenges: Finding the right talent locally can be tough, prompting companies to look beyond their borders.
2. Cost Reduction: Outsourcing can be a cost-effective solution compared to local hiring.
3. Rapid Scaling: Startups needing to grow quickly often find that external teams provide the necessary bandwidth.
4. Organizational Diversity and Liquidity: Bringing in external teams can introduce fresh perspectives and flexible structures.
Despite the benefits, a significant challenge remains: aligning your company's interests with those of your service providers. Often, these providers are driven by their own goals, primarily maximizing profit, which can sometimes conflict with the needs of their clients.
- A development agency might prioritize quick delivery over quality, leading to technical debt.
- A marketing firm could focus on short-term gains instead of building a sustainable brand strategy.
- IT support services might offer solutions that require constant maintenance, ensuring ongoing dependency and revenue.- An implementation specialist as a premium partner for a major CRM or Cloud might elect to implement a costly or overkill solution.
Keeping tabs on the performance of your partners is not just beneficial; it's essential. It fosters honest conversations, enables better evaluation and planning, and allows for a comparative analysis of various providers. Unfortunately, many companies lack the tools and systems to effectively monitor this performance.
TargetBoard revolutionizes how tech startups can manage and evaluate their external partnerships. With its user-friendly interface and comprehensive metrics, TargetBoard offers a seamless solution for comparing partners, consultants, and agencies against each other and even against your in-house teams.
.png)
Serendipity, the occurrence and development of events by chance in a happy or beneficial way, is a cornerstone of innovation. It requires the right conditions to manifest, and when it does, it can lead to groundbreaking discoveries and improvements.
In data-driven management, serendipity translates into uncovering new and exciting insights that can propel a business forward. These insights can range from novel methods to reduce costs, boost sales, enhance performance, or even integrate new data sources that deepen our understanding. The essence of serendipity lies in finding and leveraging significant nuggets of information that were previously hidden.
To foster serendipity, the right people need to be in the right place at the right time, equipped with the right mindset. They must be motivated, focused on achieving their goals, and able to ideate, experiment, and execute without barriers or friction.
Allow us to share two recent meetings that illustrate the impact of serendipity in analytics:
In a conversation with a C-level executive from a mid-sized enterprise (3,000 employees), he shared a frustrating reality: every time he had a data-related question, it took up to six months to get an answer. This prolonged timeline was due to a convoluted process involving multiple stages and people, each with a narrow understanding of the original intent. It resembled a game of "Chinese whispers," where the message gets distorted along the way. The teams involved lacked the domain expertise and context needed to provide swift and accurate insights. In such an environment, serendipity and innovation are stifled. Management is left to make decisions based on limited resources and insights, constrained by the time-consuming process.
In contrast, a Senior Director from another tech organization (1,500 employees) shared a different story. They had adopted TargetBoard to replace their traditional data team, empowering managers directly. Weekly meetings with this organization are a testament to the power of serendipity. Every week, new and interesting insights emerge, leading to actionable improvements for the business. The cost of testing or making changes is nearly zero, and results are instantaneous. By connecting domain experts with the data they need through a frictionless tool, barriers are removed, allowing innovative ideas to flourish.
One example from our last meeting stands out: “Hey, you know what would be really cool? If we could see a metric of Cycle Time divided by estimated Story Points. This would allow me to finally normalize the velocity between all our teams.” With TargetBoard, such ideas are not only possible but easy to implement.
TargetBoard is on a mission to democratize decision-making for managers. We are fortunate to have amazing partners who share our vision. By removing barriers and providing the right tools, we enable serendipity to thrive, leading to continuous innovation and improvement.
In conclusion, serendipity analytics is about creating the conditions where chance discoveries can lead to significant business advancements. By empowering managers with the right tools and fostering an environment of experimentation and swift execution, TargetBoard helps turn serendipitous moments into strategic advantages.
.png)
In the dynamic world of business, the ability to swiftly and accurately access comprehensive data is not just advantageous – it’s imperative. Whether it's a venture capitalist assessing a potential investment, a company navigating an acquisition, or an executive crafting a strategic "30-60-90" plan, the common denominator remains: the need for rapid, reliable, and thorough data insights. Traditional methods of data analysis, while thorough, often fall short in terms of efficiency and speed. This is where TargetBoard revolutionizes the game.
For Investors and M&A Events: In high-stakes scenarios like investments or mergers and acquisitions, due diligence is crucial. Stakeholders require full access to a company’s performance KPIs to make informed decisions. The traditional approach, relying on analysts and extensive reports, is time-consuming and can delay critical decisions.
For New Managers and Executives: Executives stepping into new roles need a quick, accurate understanding of their operational landscape to formulate effective “30-60-90” plans. These plans must be grounded in real data and measurable targets to set the stage for success.
Traditional Approach
Typically involves assembling a team of analysts to compile and assess necessary data points. This process, from data collection to quality assessment, can span weeks, delaying decision-making and increasing overhead.
The TargetBoard Advantage
TargetBoard dramatically simplifies this process. With TargetBoard, you gain access to all necessary company data and analytics within minutes. The key benefits include:
- Complete and Comprehensive Data: Access a holistic view of a company's performance metrics quickly.
- Trusted, Verifiable Accuracy: Confidence in data accuracy ensures that strategic plans are based on solid foundations.
- Rapid Insights: Shift from weeks of analysis to instant data accessibility, accelerating the decision-making process.
- Reduced Overhead: Minimize distractions for your team, allowing them to focus on core activities instead of lengthy data compilation and analysis.
TargetBoard not only provides a solution for rapid data access but redefines how businesses approach strategic planning and decision-making. Its intuitive design and powerful analytics tools mean that comprehensive, accurate data is no longer a bottleneck in the decision-making process, but a powerful catalyst for strategic action. Whether it’s evaluating a potential investment or stepping confidently into a new executive role, TargetBoard ensures that your decisions are informed, timely, and backed by the best data available.
In the modern business landscape, where time is as valuable as information, TargetBoard stands as an essential tool for efficient, data-driven decision-making. It's more than just a platform; it's a strategic partner that empowers businesses to make informed decisions swiftly and confidently. Embrace the future of business analysis with TargetBoard – where data, speed, and accuracy converge.
.png)
Effective project management is crucial, especially for tech startups in their growth stage. Despite its importance, many companies overlook this aspect, often entrusting product or development managers with the task without specialized support. This approach, however, overlooks the complexities involved in tracking Key Performance Indicators (KPIs) of a project.
KPIs are essential for measuring the success and efficiency of a project. However, tracking these metrics can be challenging. Data availability, accuracy, and timeliness are common issues. Moreover, companies often recognize the need for KPI tracking after a project has already commenced, leading to retroactive planning and data collection.
A significant consequence of not tracking project KPIs effectively is the lack of visibility into a project's progress. This opacity creates friction among management team members and leads to a considerable waste of time. Managers often find themselves in a constant hustle to compile and present KPIs ad-hoc, multiple times a day. This process not only consumes valuable time but also impedes efficient communication within the team.
In the realm of project management, several KPIs are crucial for monitoring progress and success. These include:
1. Project Completion Rate: Measures the percentage of projects completed within the stipulated timeframe.
2. Budget Variance: Tracks the difference between the budgeted and actual cost of the project.
3. Scope Creep: Monitors any changes or expansions in project scope beyond the original plan.
4. Resource Utilization: Assesses how efficiently resources (both human and material) are used.
5. Milestone Achievement: Tracks the completion of key stages within the project timeline.6. Team Performance: Evaluates the productivity and efficiency of the team members.
Managing multiple projects adds further complexity. Each project may have different KPIs and tracking requirements, making a unified system like TargetBoard essential for coherent and efficient management.
TargetBoard simplifies the process of tracking these KPIs. It integrates seamlessly with existing systems, providing immediate and hassle-free access to essential project metrics. This accessibility is crucial for making informed decisions and keeping projects on track.
TargetBoard is designed to be adaptable. It can be used at any stage of a project, allowing for retroactive data filling and redefining project scopes based on accurate, up-to-date information.Tracking KPIs is a fundamental part of successful project management. TargetBoard offers a streamlined, comprehensive solution, ensuring that project managers have the data they need to guide their projects to successful completion. This tool is indispensable for companies aiming to enhance their project management capabilities and achieve better outcomes.
.png)
Fostering a healthy competitive culture within organizations is beneficial and essential for success. This principle holds across all departments and businesses, regardless of size or industry. In every group, performance levels will naturally vary among members. However, creating a positive environment where individuals are motivated to excel and equipped with the necessary tools and infrastructure can transform individual outcomes and overall business success.
1. Tech Stars: In the fast-paced world of technology startups, a leading software development company implemented a quarterly hackathon encouraging teams to innovate new product features. The winning team received a prize and had their feature fast-tracked into development. This initiative not only spurred a friendly rivalry among teams but also led to significant product advancements, boosting team morale and market competitiveness.
2. Sales Stars: A multinational retail corporation introduced a monthly sales leaderboard highlighting top regional performers. This was complemented by a peer recognition program where employees could nominate colleagues for exceptional customer service or teamwork. These measures increased sales figures and fostered a culture of mutual respect and collaboration, with employees feeling more valued and connected to the company’s goals.However, creating such an environment is not without its challenges. It requires a meticulous approach to collecting data, analyzing it, and implementing processes and tools that effectively leverage this information.
With TargetBoard, you can access a comprehensive suite of tools that empower you to understand and compare performance across various lines such as Teams, Products, Services, Markets, and more. TargetBoard simplifies showcasing and interpreting performance data, making it easy to see how your results stack up against the past or other groups. This clarity enables you to learn from successes and apply these lessons across the board, thereby elevating the entire organization.
1. Immediate Implementation: Get everything you need from day one to start making informed decisions.
2. Comprehensive Comparisons: Easily compare different aspects of your business to identify strengths and areas for improvement.3. Shared Success: Foster an environment where learning from each group's successes becomes a pathway to collective improvement.
In conclusion, by integrating TargetBoard into your strategic toolkit, you ensure that your organization remains competitive and thrives in an ever-evolving business landscape. Unlock the full potential of your team and lead your business to new heights with TargetBoard.
.png)
In the realms of Business Intelligence (BI), Analytics, and Performance Management, the quality of data is a pivotal concern, encapsulated in the principle of "Garbage In - Garbage Out." For a Chief Technology Officer (CTO) at a SaaS company, understanding the nuances of this problem is crucial for effective decision-making and strategic planning.
Let's delve into the various types of bad data that can compromise the integrity of BI systems:1. Missing Data: Vital information gaps can skew analysis. For instance, if a SaaS company's user engagement data is incomplete, it might miss out on crucial patterns that could inform product development.2. Late Data: Timeliness is key. Data not updated on time can lead to outdated insights. Imagine making pricing decisions based on last quarter's market trends, not considering recent competitor actions.3. Incomplete Data: Partial datasets can lead to misleading conclusions. For example, if customer feedback is only partially recorded, it might paint an inaccurately rosy picture of user satisfaction.4. Dirty Data: This includes duplications or mixed-up test data. A CTO might find conflicting user counts due to such discrepancies, complicating capacity planning.5. Loosely Defined Data: Without a consensus on what data represents, interpretations vary. For instance, differing definitions of "active user" can lead to disagreements on user engagement levels.6. Biased Data: Unrepresentative data skews analytics. If user feedback is primarily sourced from a particular demographic, it won't accurately reflect the broader user base's needs.
Most BI and analytics products sidestep these issues, leaving the responsibility for data quality to the customer's internal teams. This approach is increasingly unsustainable as data volumes and sources grow, leading to heightened overhead and maintenance costs. The dynamic nature of data and its structures makes maintaining its quality a complex, ongoing challenge.
This problem is particularly pronounced in no-code environments, where users often lack in-depth data training. In such settings, the risk of propagating inaccurate data across the organization is high, jeopardizing decision-making processes.
At TargetBoard, we are committed to breaking this cycle. We are investing in unique capabilities to ensure our customers have access to fully accurate KPIs, without imposing any additional cost or effort. Our solution is designed to address these diverse data quality issues head-on, enabling CTOs and their teams to rely on their BI tools with newfound confidence.
.png)
Managers are expected to have a clear understanding of their performance, progress, goals, and strategy, but keeping track of KPIs can be difficult due to role transitions, organizational changes, and limited resources. This gap in knowledge can lead to poor perception, operational inefficiencies, and ongoing challenges in decision-making.
In the realm of management, expertise is not just expected, it's demanded. Whether you're navigating the intricacies of technology, product development, or operations, your role as a manager hinges on having comprehensive knowledge of your domain. This is particularly true when it comes to Key Performance Indicators (KPIs).
As a manager, you are expected to have a firm grip on several critical aspects:1. Current Position: Knowing exactly where you stand in terms of performance.2. Path Travelled: Understanding the reasons behind your current position.3. Future Goals: Having a clear vision of where you need to be.4. Strategy: Developing a roadmap on how to get there.
Despite the clear need for this knowledge, staying abreast of KPIs can be challenging. Common obstacles include:1. Transition Periods: Being new to a role often involves a significant ramp-up period.2. Organizational Changes: Major internal or external changes can disrupt your understanding of your area of responsibility.3. Resource Limitations: Inadequate funding or resources can hinder the ability to track and understand your domain’s performance effectively.
The inability to stay informed about your KPIs can have far-reaching implications:1. Negative Perception: Not knowing your KPIs can cast a poor light on you, potentially affecting your manager and team in certain circumstances.2. Operational Disruption: Scrambling for answers you should already have can cause frustration, anxiety, and distractions, burdening your team.3. Downward Spiral: Often, you may not be in a position to address the root cause effectively, lacking the tools and processes needed for future preparedness, leading to a continual negative cycle.
This is where TargetBoard revolutionizes your management experience. With TargetBoard, you gain:Immediate Access to KPIs: From the first day, access all your KPIs effortlessly.Ready Answers: Be equipped with the answers you need, reducing the overhead for you and your team.No Extra Infrastructure: Implement TargetBoard without the need for extensive data projects or infrastructure.
The journey of a manager doesn't have to be shrouded in uncertainty. With TargetBoard, you're not just equipped with data; you're empowered to be a master of your domain. Embrace this tool to transform your management approach from reactive to proactive, ensuring that you're always a step ahead in your leadership journey.

In today's fast-paced business world, choosing the right technology solutions and vendors is more than just a matter of preference; it's a strategic decision that can significantly impact an organization's flexibility and growth. A critical factor in this decision-making process is the concept of vendor lock-in—the extent to which a company is tied to a specific vendor or product and the associated costs and complexities of switching to a different solution.
Many technology products today come with integrated Business Intelligence (BI) and reporting features. While these functionalities often seem beneficial at first glance, they can, paradoxically, limit a company's agility. By creating a dependency on these built-in tools, vendors make it challenging for companies to move away from their products, thus increasing the stickiness and dependency.Furthermore, the integration with third-party tools often involves pulling data into proprietary BI and analytics solutions, further entrenching organizations into the vendor's ecosystem. This integration can appear advantageous, but it often leads to a complex web of dependencies that can be costly and time-consuming to untangle.
TargetBoard offers a transformative solution to this common dilemma. By connecting to third-party systems, TargetBoard extracts and models data into our proprietary semantic layer. This process helps customers decouple their critical data from source systems, significantly reducing the risk of vendor lock-in.
1. Reduced Re-platforming Costs:
By simplifying the process of migrating data and systems, TargetBoard decreases the overall expenses associated with re-platforming projects.
2. Enhanced Data Lineage and Continuity:
Our approach ensures better tracking of data origin, movement, and transformation, providing businesses with a clearer understanding and greater control over their data assets.
3. KPI Stability and Reliability:
One of the most significant advantages of using TargetBoard is the assurance that key performance indicators (KPIs) remain consistent and reliable, even when there are changes or upgrades to underlying tools. This stability is crucial for businesses that rely on data-driven decision-making.
4. Superior Analytical Capabilities:
Beyond just preserving existing functionalities, TargetBoard enhances the analytical capabilities available to businesses, often surpassing what is offered by the source systems themselves.
TargetBoard stands out for its effortless integration, regardless of your stage in the vendor migration process. Whether you're planning a transition or have already moved, incorporating TargetBoard is straightforward, risk-free, and requires minimal effort. Our platform is tailored to blend into your existing systems smoothly, allowing you to quickly benefit from uninterrupted KPI continuity, without disrupting your business operations.
In conclusion, TargetBoard empowers organizations to take control of their technology choices. By providing a way to easily extract and utilize data independent of the underlying systems, we help businesses avoid the pitfalls of vendor lock-in, ensuring they remain agile, data-savvy, and competitive in an ever-evolving market landscape.
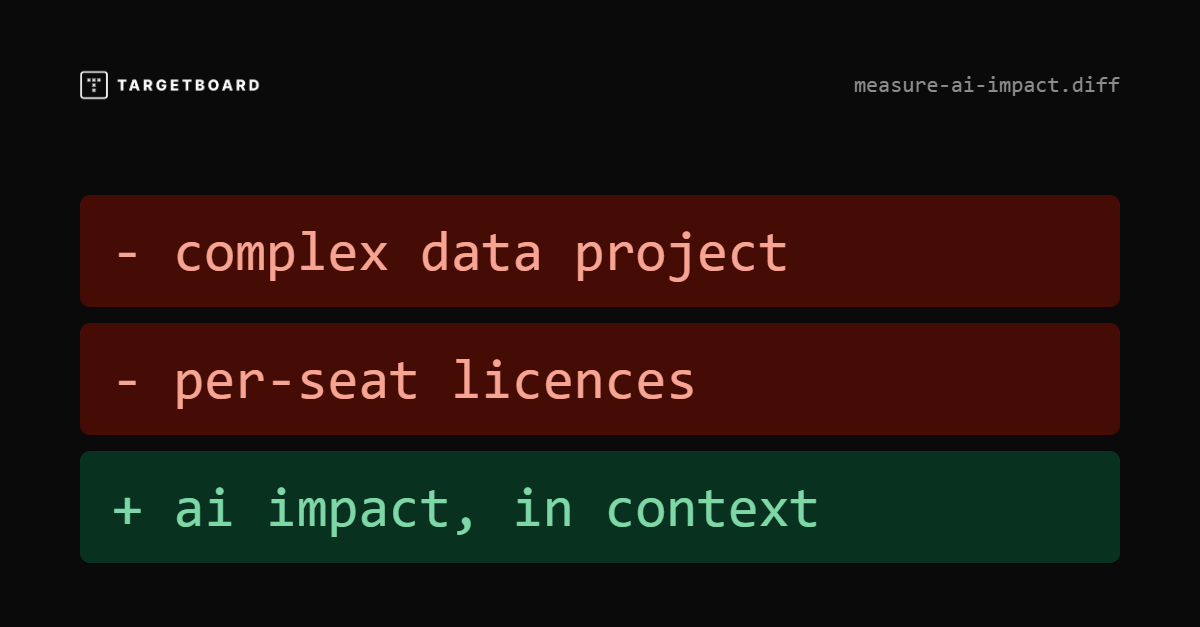
Most AI coding tools can tell you whether they are being used.
You may be able to track active users, adoption rates, suggestions, acceptance rates, generated code, token consumption, or AI-assisted activity.
That information is useful, but it does not tell you whether engineering performance improved.
Consider two teams that both significantly increase AI adoption.
Both teams can report successful adoption.
Only one is showing clear evidence of better engineering outcomes.
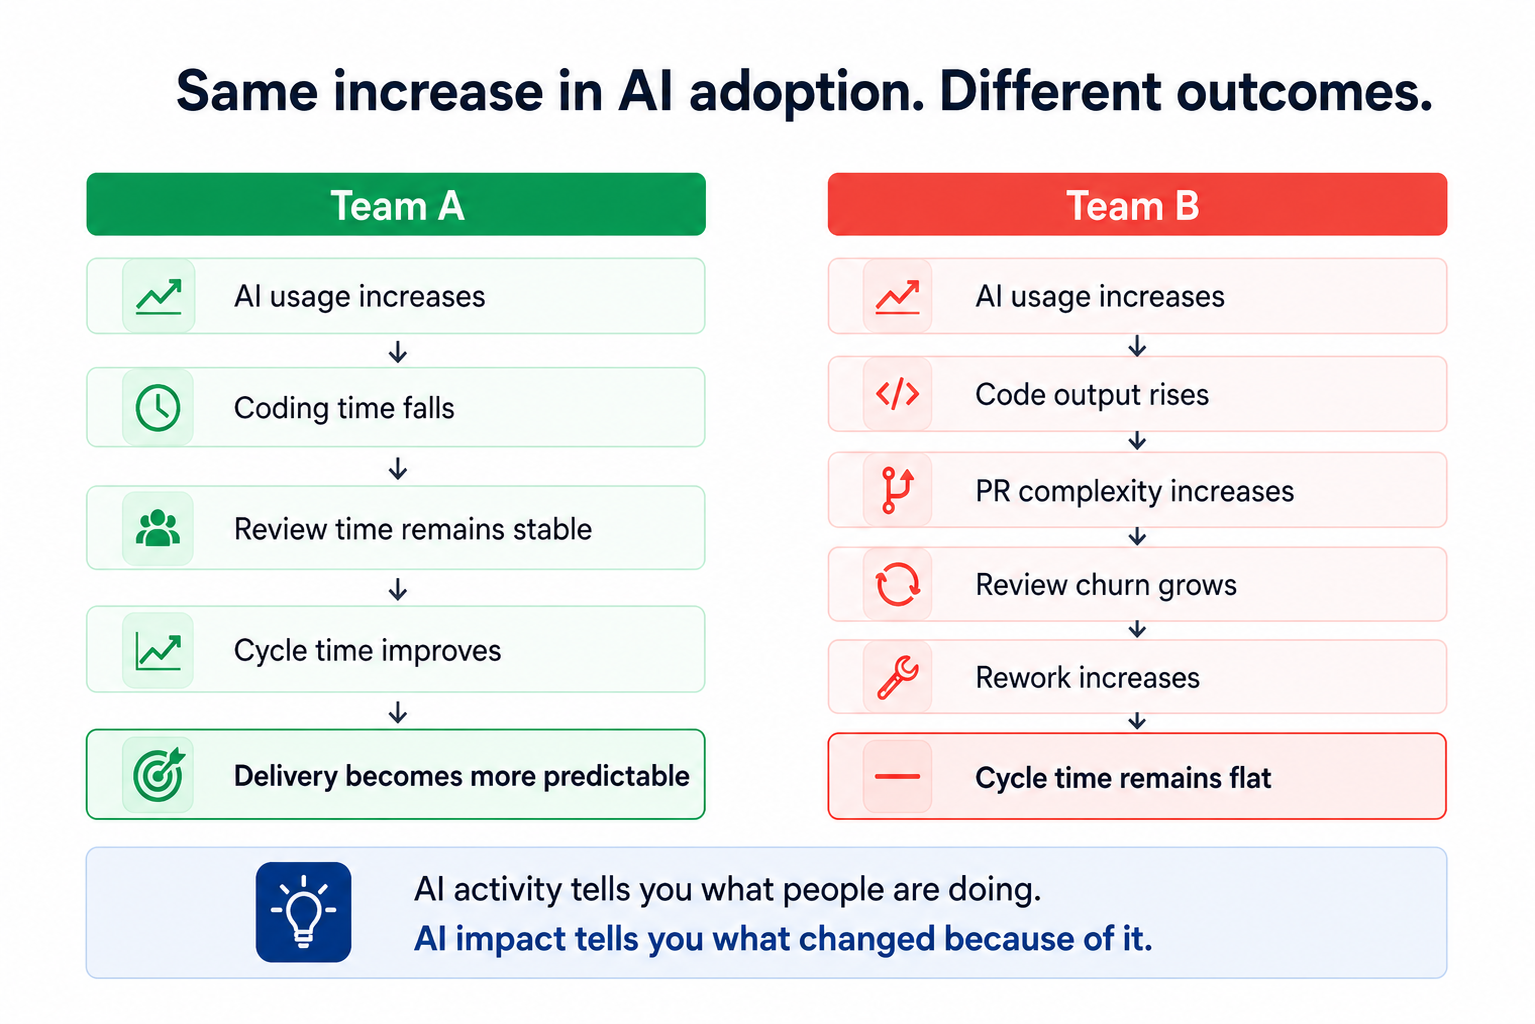
The mistake is jumping directly from adoption to ROI.
High usage does not automatically mean higher productivity, better delivery, or financial return. A more useful model is:
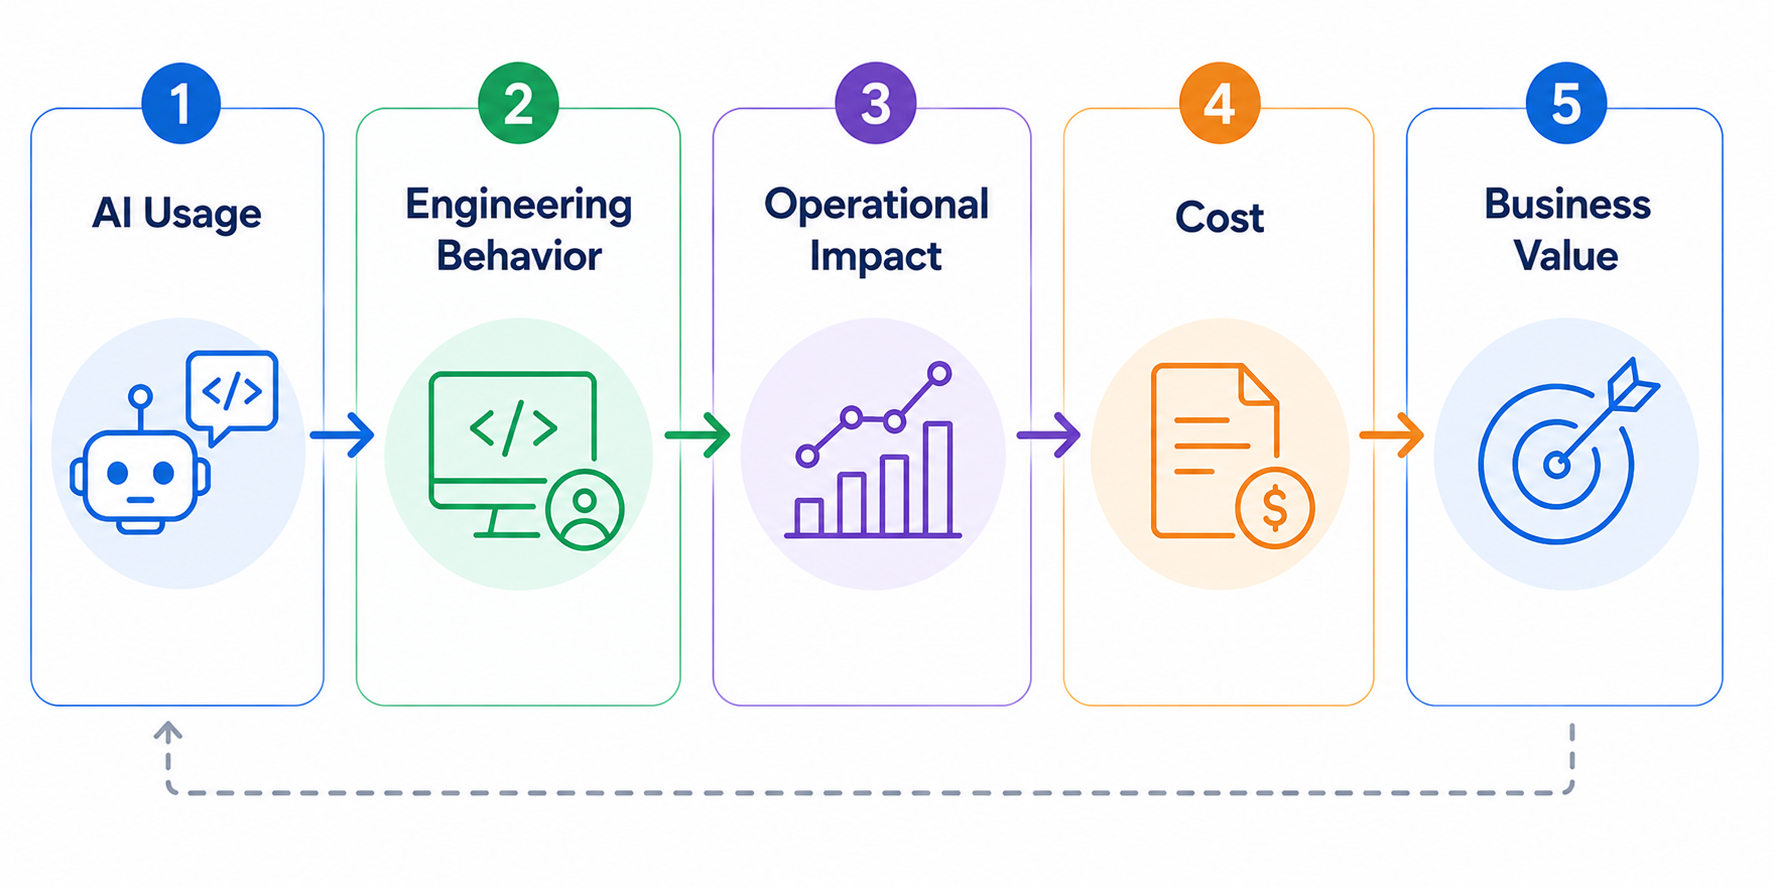
AI may reduce coding time but increase review effort.
It may increase throughput while also increasing rework.
It may deliver significant benefits to one team and almost none to another.
The useful question is not: “How much AI are we using?”
It is: “What happened to engineering performance where AI usage changed?”
Most organizations are not missing the underlying data.
The problem is that each system understands only its own part of the world.
A Cursor usage event does not know what initiative the developer was working on.
A GitHub pull request does not automatically know whether it was AI-assisted.
A Jira ticket does not understand what happened during code review.
An AI license does not tell you if the team using it became more productive.
Take a seemingly simple leadership question:
Answering it reliably may require you to:
Any one of these tasks is manageable.
The complexity comes from keeping all of them correct together.
Teams reorganize. Repositories move. Jira workflows change. AI vendors change. APIs evolve. New leadership questions appear.
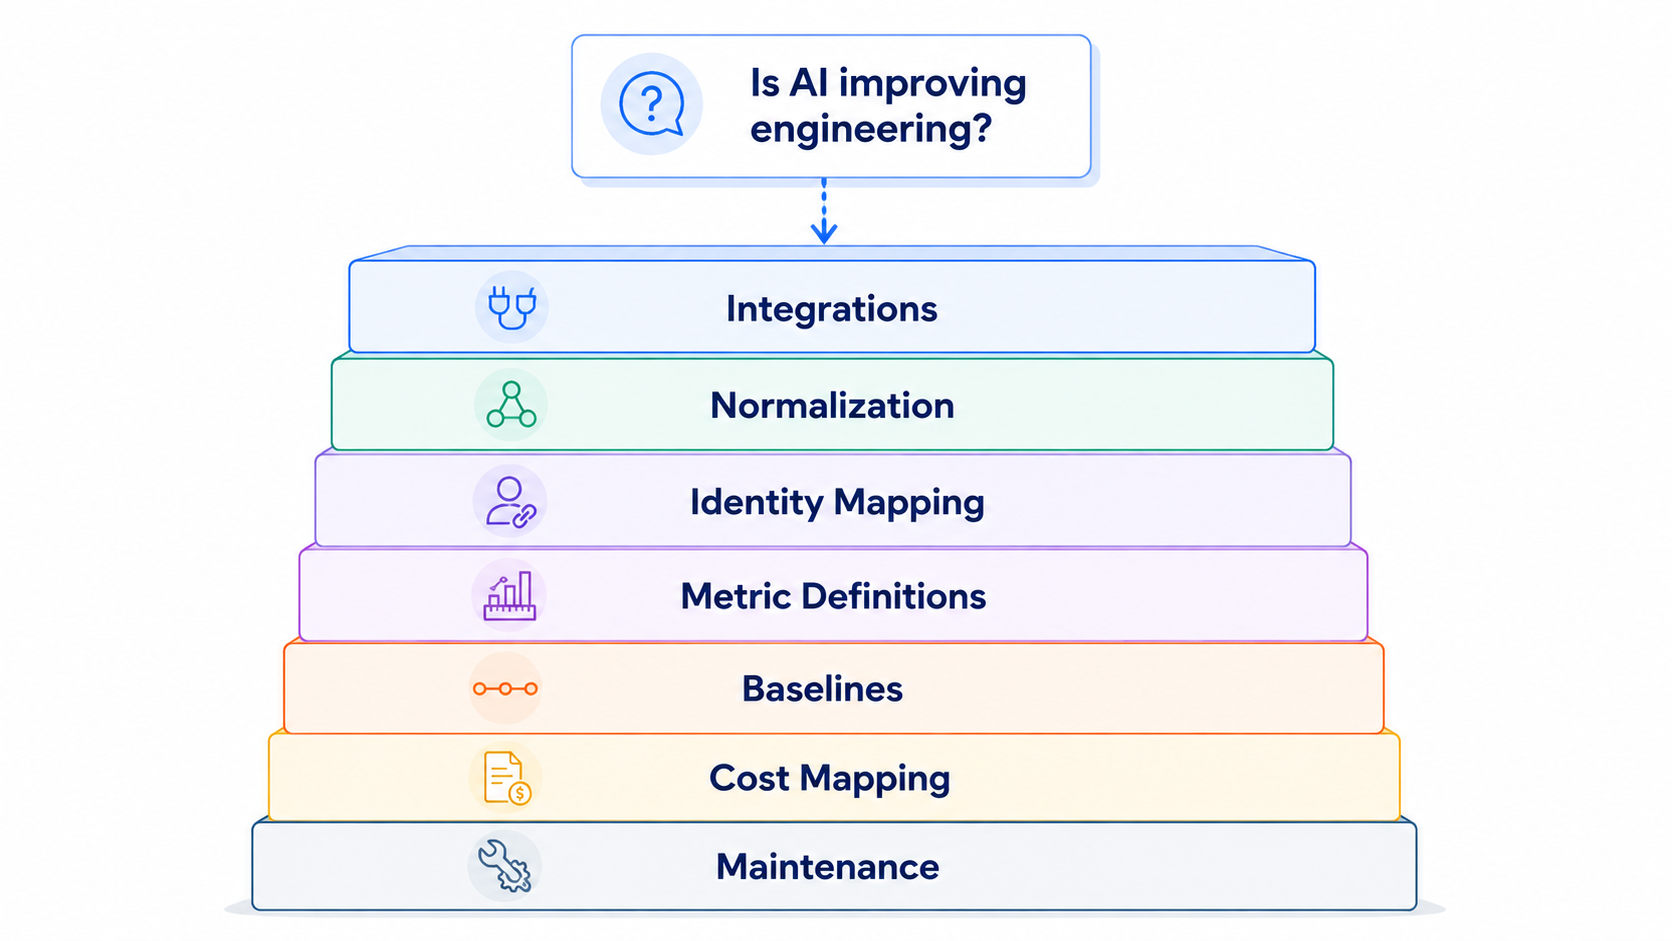
Most engineering organizations have the technical capability to build internal analytics.
APIs, warehouses, transformation tools, BI platforms, internal engineering teams, and increasingly capable AI models are all available.
The question is not whether you can build it.
It is what you want to own.
There is a big difference between connecting Jira and GitHub for a dashboard and maintaining a reliable operational model of the engineering organization.
That model needs to understand relationships between:
And those relationships need to remain accurate as the organization changes.
The internal solution therefore comes with ongoing ownership of connectors, schemas, metric governance, organizational mappings, historical consistency, tool migrations, and analytical logic.
The more useful build-vs-buy question is:
For some organizations, the answer may still be yes.
But it should be a deliberate decision.
A pull request alone can tell you its size, review time, comments, churn, and merge time. Add company context and you can also understand:
That changes the questions leadership can ask.
That is the difference between aggregating engineering data and understanding engineering performance.
Connecting the data still leaves one problem: interpretation.
A dashboard may tell you cycle time increased 18%.
Leadership still needs to determine:
Traditional reporting shows the metric.
Someone still has to explain it.
The next evolution of engineering analytics therefore cannot simply be:
more systems → one dashboard
It needs to be:
Engineering leaders need to understand what changed, what is driving it, and where action is required.
TargetBoard connects data across engineering, planning, AI, organizational, quality, cost, and other company systems while allowing teams to continue working in their existing tools.
That data is normalized into a consistent company context that preserves relationships between people, teams, repositories, work, initiatives, delivery, and outcomes.
On top of that context, domain-expert agents continuously interpret performance to surface what changed, what is driving it, and where risk or opportunity is emerging.
That enables engineering leaders to investigate questions such as:
The goal is not another dashboard. It is removing the data engineering and interpretation work standing between the question and a reliable answer.
AI coding assistants are individual-use tools, so per-seat pricing makes sense.
Engineering intelligence is different.
Its value comes from understanding the organization as a system. A developer does not need to log into an analytics platform for their work to contribute to the operational picture leadership needs.
TargetBoard does not use per-seat pricing.
The objective is organization-wide engineering and AI intelligence, not another product that has to be licensed developer by developer.
Measuring AI impact is technically solvable. The question is how much infrastructure your engineering organization wants to own in order to solve it.
If you build the capability internally, the commitment extends well beyond connecting a few APIs or creating a dashboard. Someone needs to maintain the data model, keep identities and organizational mappings accurate, absorb changes in source systems, preserve historical consistency, and continually adapt the analysis as new AI tools and new leadership questions emerge.
For organizations with highly specific requirements, that investment may be justified.
But for most engineering leaders, the more useful question is whether building and maintaining this measurement layer creates any strategic advantage.
The value is not in owning the pipelines.
It is in being able to answer, with confidence:
Those are management questions, not data-engineering outcomes.
The goal should be to spend less time assembling the evidence and more time using it to make better engineering decisions.
.png)
Most vendor evaluations combine a product demo, a limited developer trial, feature comparisons, and user feedback.
These inputs can show whether a tool is usable, trusted, secure, and compatible with the existing toolchain. They do not establish whether it improves delivery.
A developer may feel faster while using an AI assistant, yet pull requests may still require more review, create more rework, or spend longer waiting to be picked up.
Developer sentiment provides valuable context. Operational data shows what actually changed.
This distinction is particularly important for AI engineering tools. Faster code creation does not automatically lead to faster review, approval, or deployment. A tool may accelerate one stage while moving friction further downstream.
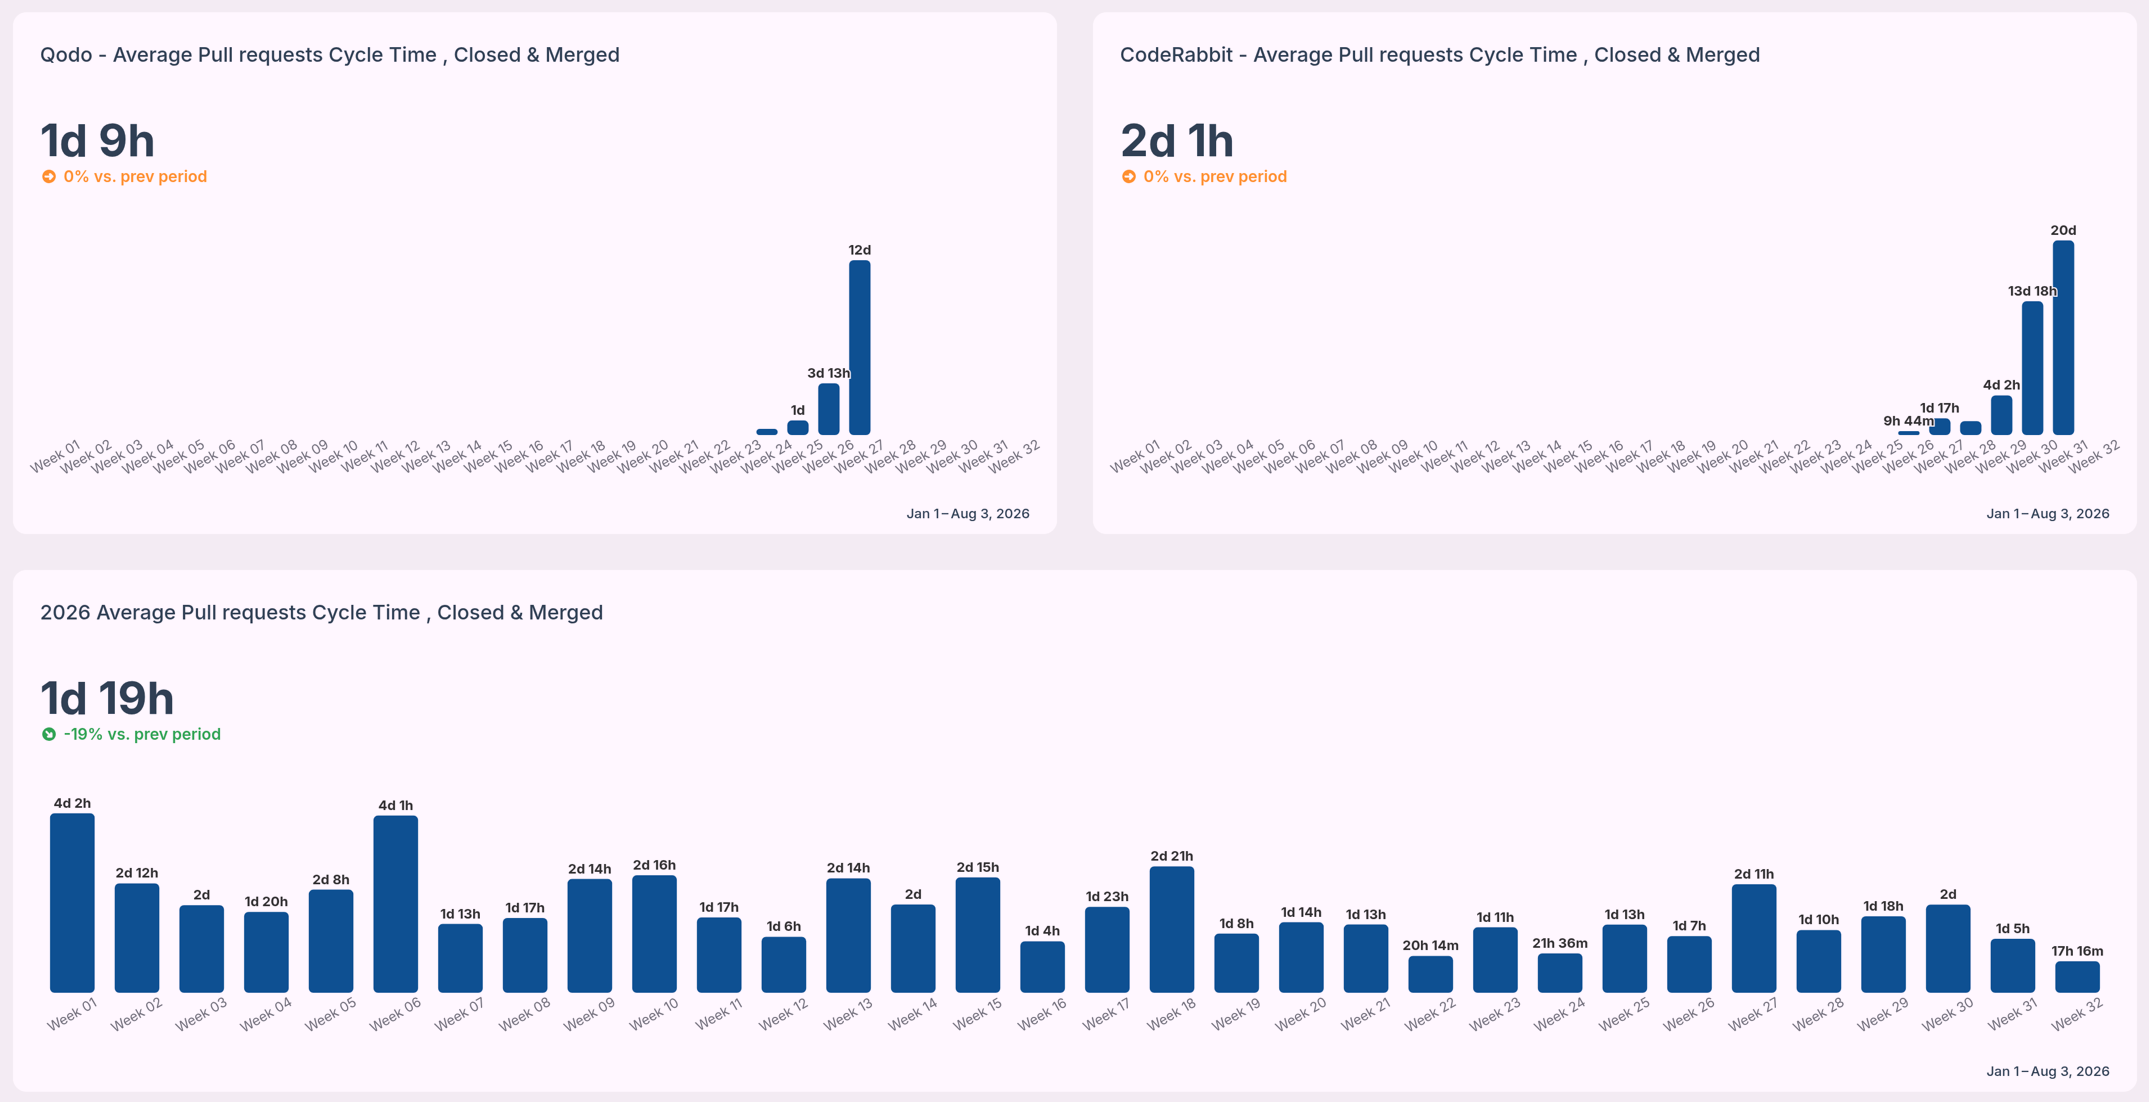
The customer wanted to compare two AI code review automation vendors: Qodo and CodeRabbit.
Rather than testing the tools with unrelated groups or comparing broad company-wide averages, the team used the same defined group of developers throughout the evaluation. Each vendor was tested during a separate period of approximately two weeks.
The methodology was straightforward:
This was not a laboratory experiment. Real engineering environments include differences in repository complexity, work type, team availability, and pull request size.
But it was a structured, real-world comparison that produced stronger evidence than a feature checklist or a collection of opinions.
The objective was not to prove that one vendor is universally better. It was to determine which vendor produced better outcomes in this customer’s environment.
The analysis depended on consistently isolating the developers participating in the POC.
Without a reusable filter, the team would have needed to rebuild the participant group for each metric and evaluation period, slowing the process and increasing the risk of inconsistent comparisons.
Using TargetBoard Saved Filters, the team defined the relevant contributors and pull request creators once, then reused the same cohort across the board.
This made it easier to:
The team could spend less time configuring the analysis and more time interpreting the results.
The customer focused on what happened after code entered the pull request workflow.
This measured the time from the first commit until the pull request was merged.
It provided an end-to-end view of whether work moved more efficiently during each vendor trial. In this evaluation, the Qodo period showed a shorter average cycle time than the CodeRabbit period.
Cycle time should be treated as a system signal. A higher result may reflect delays in pickup, review, coordination, approval, or integration.
The team also measured how many times a pull request returned to the author for changes before approval.
Fewer review cycles can indicate less back-and-forth and lower review churn. The Qodo period showed fewer average review cycles than the CodeRabbit period.
This was useful evidence, although a full quality assessment would also need to consider defects, incidents, rollbacks, and escaped issues.
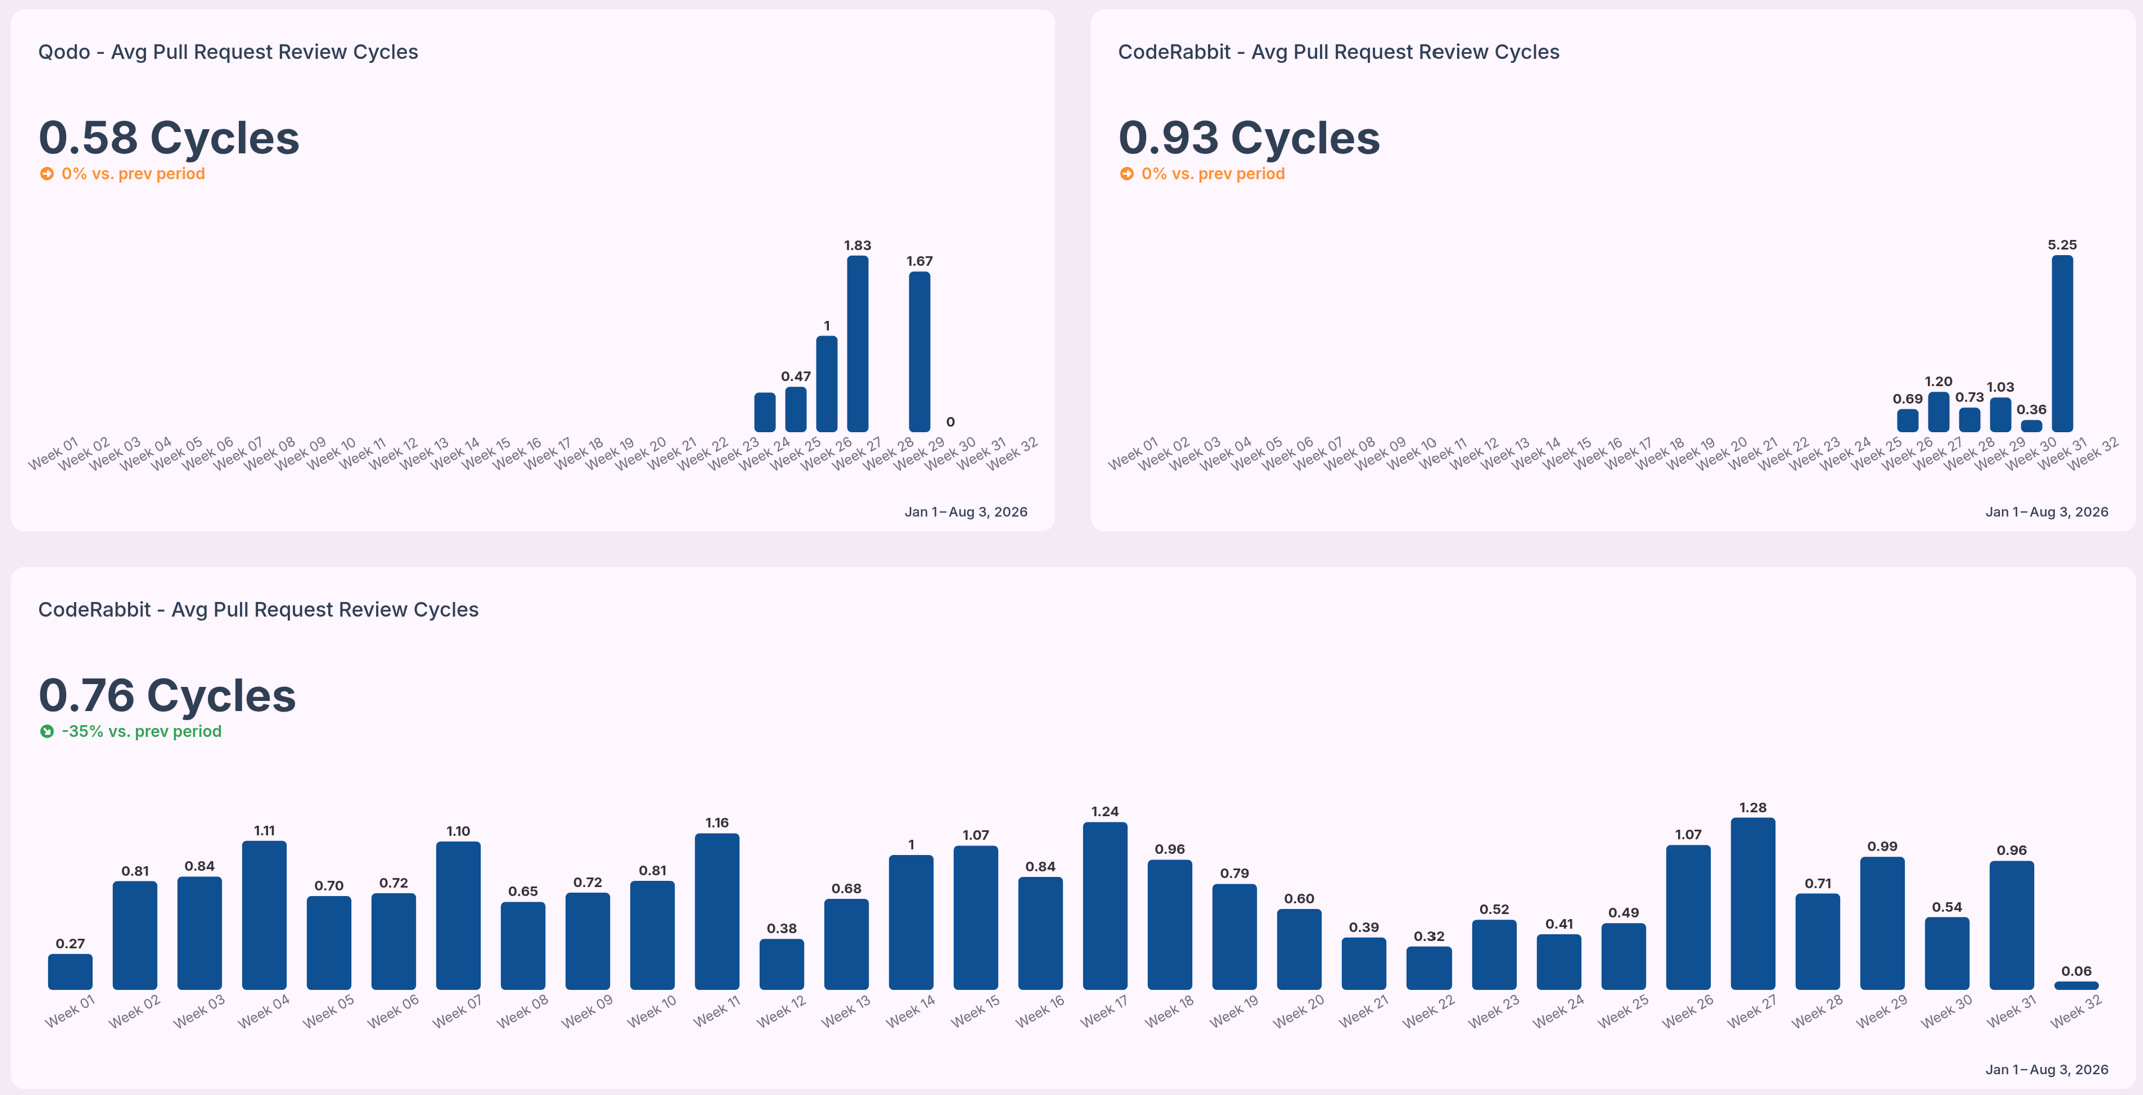
Overall cycle time shows that a difference exists. It does not explain where the delay occurred.
The customer therefore examined time spent in stages such as coding, waiting for review, active review, and merge.
This helped distinguish active work from waiting time and showed whether differences came from review pickup, review complexity, or later workflow stages.
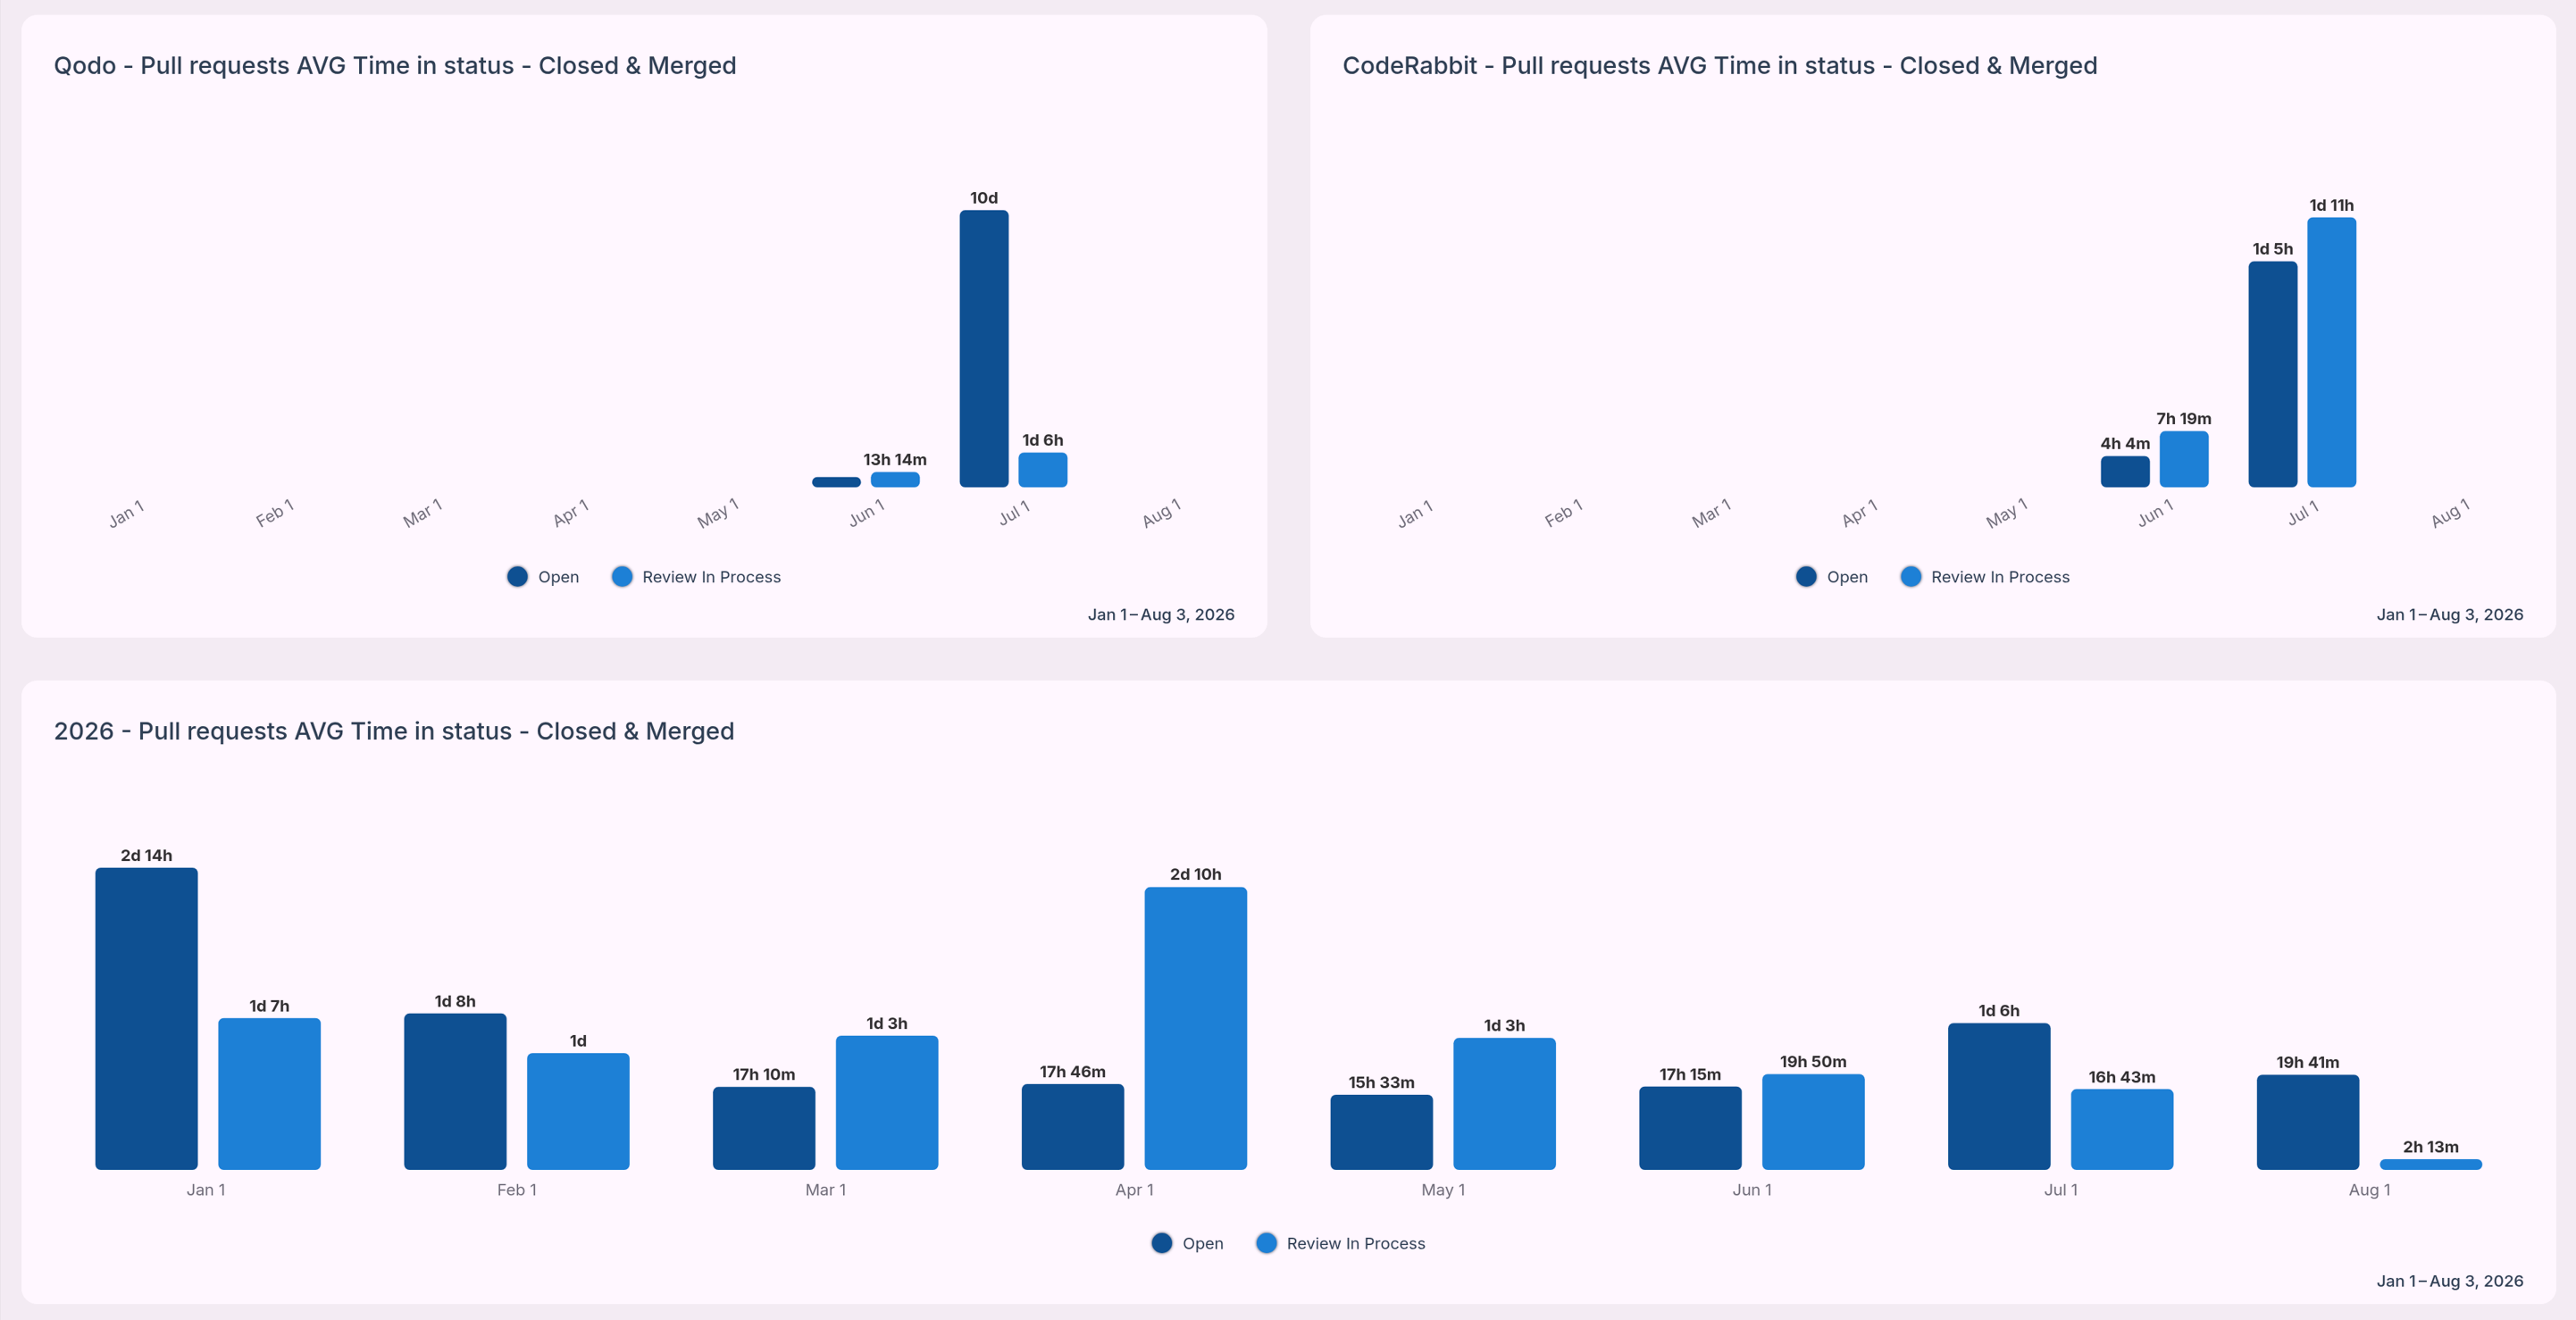
Across the metrics selected for the proof of concept, the Qodo evaluation period showed stronger results than the CodeRabbit period.
The Qodo period recorded:
These results gave the customer a concrete basis for the selection decision.
The team was no longer deciding only which product looked more capable in a demonstration or which tool developers preferred. They could compare how each vendor affected real work inside their engineering system.
The result should remain specific to this customer. It does not establish a universal benchmark for either vendor. The outcome reflected the organization’s developers, repositories, processes, work mix, and evaluation periods.
That limitation does not weaken the analysis. It is what makes the result useful.
The customer needed to know which vendor performed better in its own environment.
A useful AI vendor POC should answer two questions: “Which tool did developers prefer?” and “What changed in the delivery system when the tool was introduced?”.
To build a stronger evaluation:
No single metric should decide the outcome.
A tool may reduce review time while increasing quality risk. Another may receive strong developer feedback but show little measurable effect on delivery. A complete evaluation balances operational outcomes with usability, risk, and cost.
AI engineering vendors should be evaluated on more than features, adoption, and perceived time savings.
The real question is whether a tool improves the flow, quality, and predictability of software delivery.
By testing Qodo and CodeRabbit with a defined group of developers, applying consistent operational metrics, and using TargetBoard Saved Filters to accelerate the analysis, this customer turned a typical POC into a more defensible purchasing decision.
The result was not simply another dashboard. It was a clearer understanding of what changed, where the differences appeared, and which vendor produced the stronger outcome for that organization.
TargetBoard helps engineering leaders compare vendor performance using operational data from their own teams and workflows.
See how TargetBoard can help you build a more objective, repeatable vendor evaluation process.
An ai code review is the process of using Large Language Models to automatically analyze pull requests. These tools scan source code analysis outputs to detect syntax errors and suggest refactoring options before a human reviewer steps in. They excel at identifying boilerplate code issues and enforcing standard automated linters. But they struggle with cross-service dependencies and complex business logic constraints.
The most effective engineering teams treat an ai code reviewer as a high-speed assistant rather than an autonomous decision-maker. AI models lack the operational context to make final architectural decisions. They can't negotiate API contracts or understand why a specific workaround exists for a legacy system.
That means a human-in-the-loop review remains absolutely critical. You use the AI to clear out the noise of code formatting and basic threat detection, so your senior engineers can focus their cognitive energy on system design and business logic.
A major limitation of current AI tools is their reliance on file-level analysis. An AI assistant might review a single pull request and confirm the syntax is perfect. Yet that same code might break cross-service dependencies three layers deep in your application.
This happens because AI context windows face strict VRAM limits and memory constraints, preventing them from holding your entire codebase in memory at once. Trusting AI file-level analysis without verifying the broader repository context is a common mistake that leads directly to architectural drift. Your delivery pipeline must connect code changes to system-wide impacts to prevent this risk.
Yes, a code review ai is highly accurate when evaluating isolated syntax and standard formatting rules. Conversely, accuracy drops to near zero when evaluating complex logic or proprietary frameworks. This drop in precision introduces high rates of false positives and AI hallucinations into your pull requests.
Consider a common scenario where an AI tool successfully identifies a missing variable declaration but completely misses a breaking change in your core payment processing logic. The AI then floods the pull request with dozens of comments about stylistic formatting. Developers end up arguing with an AI bot in the comments over subjective syntax choices, creating massive review churn.
This noise creates an overwhelming backlog for human reviewers and actively slows down sprint velocity. Developer overreliance on these tools compounds the problem. Junior engineers might blindly accept AI suggestions without understanding the underlying code, injecting hidden technical debt into the system. You must measure this friction continuously to ensure the tool is actually accelerating your workflow rather than just generating noise.
Selecting the best ai code review tools requires matching the platform's core capability to your specific workflow bottleneck. You must differentiate between tools that generate code, platforms that scan for vulnerabilities, and systems that measure the systemic impact of those changes.
Tools like CodeRabbit and Qodo focus heavily on pull request summarization. They read the diff and generate a plain-language summary of the changes, so human reviewers can grasp the intent faster. This approach often improves initial time-to-merge metrics for simple tasks.
But open source ai code review tools in this category can struggle when deployed on massive enterprise monorepos. The sheer volume of interconnected files overwhelms the model. This leads to generic summaries that fail to capture the actual architectural impact of the change.
GitHub Copilot and similar IDE extensions operate directly where developers write code. These tools use agentic workflows to suggest entire functions as the developer types. They are incredibly effective at reducing the time spent writing boilerplate syntax.
They operate with a limited view of the broader system. A native extension might suggest a highly efficient sorting algorithm, yet it can't verify if that logic violates broader API contracts established by another team. Human reviewers must still validate those systemic connections.
Enterprise platforms like SonarQube and Greptile focus on strict CI/CD integration. They run deep static analysis to ensure your codebase maintains OWASP compliance and prevents known vulnerabilities from reaching production. These tools are non-negotiable for teams operating in highly regulated environments.
A major consideration in this category is data sovereignty. Sending proprietary enterprise code to external models for security scanning introduces compliance risks. You must configure these tools to ensure sensitive data remains within your controlled infrastructure.
Adopting ai powered code review tools frequently increases raw output while secretly damaging delivery predictability. You need a way to measure this friction. TargetBoard is an agentic operational intelligence platform that helps leadership teams understand how execution is performing, why it is changing, and how to respond.
TargetBoard connects data across company systems and uses domain-expert AI agents to understand workflow bottlenecks. It acts as the essential operational intelligence layer that shows you if your AI coding tools are actually improving sprint velocity or just creating massive review churn.
Implementing ai code reviews requires strict boundaries. You must configure the tool to handle objective rules while reserving subjective architectural decisions for human engineers. If you fail to set these boundaries, the AI will argue with your developers over code formatting and stylistic preferences.
This friction causes massive review churn and slows down your entire pipeline. You must structure the workflow to prevent this noise.
You must map exactly where the AI intervenes in your Software Development Lifecycle. The AI should run its analysis immediately upon pull request creation. It scans for syntax errors, basic code smells, and formatting violations.
The developer resolves these objective flags before a human reviewer is ever assigned to the pull requests. This sequence ensures your senior engineers only spend their time reviewing complex logic and system architecture.
You must train your AI tools using custom rule files specific to your repository. This step prevents the AI from suggesting changes that violate your internal business logic constraints. You can configure the tool to enforce DRY principles and flag code duplication automatically.
The interaction between these custom rule files, the model's context windows, and your code repositories determines the success of the tool. A well-configured rule file reduces false positives and ensures the AI only surfaces actionable insights.
You can't manage what you don't accurately measure. Relying on basic productivity metrics like lines of code written will mislead your leadership team. According to the 2023 DORA Report, true delivery predictability matters far more to business outcomes than raw development speed. You must measure if your ai code review tools are actually accelerating delivery or just shifting the bottleneck.
TargetBoard provides this critical measurement layer. It tracks the difference between AI-generated output and human review times. If an AI tool increases output by 40 percent but causes pull requests to sit in review for three extra days, your actual sprint velocity decreases. TargetBoard exposes these hidden workflow bottlenecks, so you can adjust your strategy based on objective operational intelligence rather than intuition.
The primary value of an AI code review tool is workflow efficiency, not replacing human architectural judgment. These tools are highly effective at clearing out boilerplate errors and enforcing basic code quality. Yet they introduce their own hidden complexities that require continuous systemic measurement.
According to 2024 GitHub Copilot research, AI assistants boost developer productivity by up to 55 percent. You must balance that speed with strict oversight to protect codebase maintainability and prevent the accumulation of technical debt. By running an operational intelligence layer alongside your AI tools, you can safely accelerate software delivery while maintaining complete confidence in your engineering metrics.
.png)
Why Good Release Metrics Mask System Degradation
Measuring software quality at the exact moment of delivery leaves engineering leadership entirely unaware of impending production failures. Teams rely heavily on release-day validation to confirm that code meets baseline standards. They look at pass rates and approve the merge. The problem is that these snapshot metrics only prove the code functions in a controlled environment at a specific point in time.
A release might ship with 90% code coverage and clean static analysis, yet trigger a massive spike in incidents and severe rework just two weeks later. This happens because static checks can't account for the compounding friction that new code introduces to the broader system. Over time, this hidden technical debt erodes delivery confidence and forces teams to spend cycles fixing what they just built. True quality is an ongoing observation of post-release degradation, not a one-time check at the finish line.
Modern development tools have fundamentally changed how work is produced. Engineers now use AI assistants to write massive amounts of code in minutes. This accelerates initial code commits, but it exponentially increases pull request size and review churn. Reviewers struggle to mentally parse the sheer volume of logic generated by machines. This creates severe engineering drag across the delivery pipeline.
The AI-generated code impact looks great on a velocity chart, yet it quietly introduces code complexity and maintainability risks that bypass standard quality gates. Syntactically correct code often introduces subtle architectural flaws that only surface under live production loads.
People often ask how to measure software code quality when they actually need to measure system health. Engineering teams must separate how they validate code from how they evaluate system behavior. Code validation happens during the software development lifecycle before a merge. It relies on static code analysis to catch syntax errors and security vulnerabilities. This is a necessary step, but it's entirely localized.
System behavior measures how that code interacts with existing infrastructure, user traffic, and cross-team dependencies after deployment. When teams confuse validation with behavior, they optimize for merging code rather than running stable systems. This misalignment directly causes code review bottlenecks and unpredictable delivery cycles.
To measure code quality accurately at the validation stage, teams track three core indicators of codebase health. These metrics catch obvious structural flaws during active development.
Efficiency metrics evaluate how well the application uses resources and resists failure once code moves closer to deployment.
When evaluating what the key quality indicators are for modern systems, engineering leaders must look past the release date. True software quality metrics track post-release behavior over a sustained period. This reveals the actual system stability and fragility that snapshot metrics miss. Focusing on these four indicators provides the delivery predictability required to align engineering output with business goals.
Software reliability is defined by how the system handles continuous user behavior over time. To measure this, track these specific signals:
Workflow friction is a massive hidden indicator of poor quality. According to Stripe's Developer Coefficient report, engineers already spend up to 42% of their workweek dealing with maintenance, rework, and bad code. When teams adopt AI code generation, they often see an explosion in pull request complexity that compounds this baseline friction. The initial commit happens instantly, yet the subsequent review process drags on for days. This creates severe coordination gaps and forces developers into endless cycles of rework. If engineers spend more time fixing recent commits than building new features, the system's underlying quality is degrading regardless of what the test coverage says.
When a system fails, the speed of restoration matters more than the failure itself. Monitor these operational signals:
Industry frameworks like DORA metrics provide useful lagging signals for delivery speed and stability. They track deployment frequency, lead time for changes, and the change failure rate. But leaders often make the mistake of treating these metrics as a complete measure of developer productivity rather than a set of lagging delivery signals.
High deployment frequency can actually inflate perceived software quality artificially while masking a deteriorating time-to-restore service. A team might ship ten times a day, yet if every release requires hotfixes, the speed is a liability. DORA metrics tell you what happened, so you must pair them with deep operational context to understand why it happened.
To transition from snapshot validation to system-level outcomes, you need a structured approach that tracks performance over time. Standard frameworks provide signals, but they lack the cross-system understanding required to maintain execution alignment.
To implement a time-based framework, follow these core steps.
Engineering leaders constantly face the operational pain of attempting to manually correlate data from different systems to explain a drop in velocity to the board. You know the metrics look great at release, yet the system degrades weeks later. The data required to understand this degradation is fragmented across Jira, GitHub, and production logs. This manual reporting overhead traps leaders in a reactive state, leaving them with weak decision-making signals and eroding trust in engineering reporting.
The bottleneck is no longer visibility, but cross-system understanding. Because AI-assisted development generates massive data with hidden complexity, organizations need an active metric intelligence layer. TargetBoard is an agentic operational intelligence platform that connects data across company systems, interprets performance continuously through operational intelligence, and uses domain-expert AI agents to translate insights into decision-ready inputs that guide execution. It complements standard code validation by explaining exactly why performance is changing, ensuring operational intelligence drives every decision.
To eliminate data silos and achieve true execution alignment, you must unify your signals.
According to the Consortium for Information & Software Quality, the cost of poor software quality in the US reached $2.41 trillion in 2022. Much of this cost stems from unmanaged technical debt and hidden cross-team dependencies. Software quality measurement is not about penalizing individual developers or obsessing over static pass rates. It's about understanding how work flows through your systems and how it behaves in production.
When you shift from snapshot metrics to continuous operational intelligence, you regain delivery confidence. Understanding these post-release patterns gives you a clear framework for your next architectural decision or your next board presentation. You can finally stop reacting to broken releases and start proactively aligning your engineering execution with your business goals.
In the dynamic landscape of technology startups, the reliance on external outsourcing, offshore teams, or agency support is increasingly common. Whether it's for development, product management, QA, IT, support, or marketing, these partnerships can be pivotal. However, aligning the interests of your company with those of your service providers is a nuanced challenge. This article explores the importance of tracking partner performance and how TargetBoard simplifies this crucial task.
Tech startups often turn to external talent for several reasons:
1. Talent Acquisition Challenges: Finding the right talent locally can be tough, prompting companies to look beyond their borders.
2. Cost Reduction: Outsourcing can be a cost-effective solution compared to local hiring.
3. Rapid Scaling: Startups needing to grow quickly often find that external teams provide the necessary bandwidth.
4. Organizational Diversity and Liquidity: Bringing in external teams can introduce fresh perspectives and flexible structures.
Despite the benefits, a significant challenge remains: aligning your company's interests with those of your service providers. Often, these providers are driven by their own goals, primarily maximizing profit, which can sometimes conflict with the needs of their clients.
- A development agency might prioritize quick delivery over quality, leading to technical debt.
- A marketing firm could focus on short-term gains instead of building a sustainable brand strategy.
- IT support services might offer solutions that require constant maintenance, ensuring ongoing dependency and revenue.- An implementation specialist as a premium partner for a major CRM or Cloud might elect to implement a costly or overkill solution.
Keeping tabs on the performance of your partners is not just beneficial; it's essential. It fosters honest conversations, enables better evaluation and planning, and allows for a comparative analysis of various providers. Unfortunately, many companies lack the tools and systems to effectively monitor this performance.
TargetBoard revolutionizes how tech startups can manage and evaluate their external partnerships. With its user-friendly interface and comprehensive metrics, TargetBoard offers a seamless solution for comparing partners, consultants, and agencies against each other and even against your in-house teams.
Effective project management is crucial, especially for tech startups in their growth stage. Despite its importance, many companies overlook this aspect, often entrusting product or development managers with the task without specialized support. This approach, however, overlooks the complexities involved in tracking Key Performance Indicators (KPIs) of a project.
KPIs are essential for measuring the success and efficiency of a project. However, tracking these metrics can be challenging. Data availability, accuracy, and timeliness are common issues. Moreover, companies often recognize the need for KPI tracking after a project has already commenced, leading to retroactive planning and data collection.
A significant consequence of not tracking project KPIs effectively is the lack of visibility into a project's progress. This opacity creates friction among management team members and leads to a considerable waste of time. Managers often find themselves in a constant hustle to compile and present KPIs ad-hoc, multiple times a day. This process not only consumes valuable time but also impedes efficient communication within the team.
In the realm of project management, several KPIs are crucial for monitoring progress and success. These include:
1. Project Completion Rate: Measures the percentage of projects completed within the stipulated timeframe.
2. Budget Variance: Tracks the difference between the budgeted and actual cost of the project.
3. Scope Creep: Monitors any changes or expansions in project scope beyond the original plan.
4. Resource Utilization: Assesses how efficiently resources (both human and material) are used.
5. Milestone Achievement: Tracks the completion of key stages within the project timeline.6. Team Performance: Evaluates the productivity and efficiency of the team members.
Managing multiple projects adds further complexity. Each project may have different KPIs and tracking requirements, making a unified system like TargetBoard essential for coherent and efficient management.
TargetBoard simplifies the process of tracking these KPIs. It integrates seamlessly with existing systems, providing immediate and hassle-free access to essential project metrics. This accessibility is crucial for making informed decisions and keeping projects on track.
TargetBoard is designed to be adaptable. It can be used at any stage of a project, allowing for retroactive data filling and redefining project scopes based on accurate, up-to-date information.Tracking KPIs is a fundamental part of successful project management. TargetBoard offers a streamlined, comprehensive solution, ensuring that project managers have the data they need to guide their projects to successful completion. This tool is indispensable for companies aiming to enhance their project management capabilities and achieve better outcomes.
.png)
Problem: Teams often prioritize short-term deadlines over sustainable software architecture to meet immediate market demands. This creates hidden structural compromises within the codebase.
Solution: Engineering leaders must treat this deferred maintenance as a measurable business liability that directly impacts engineering velocity and resource allocation.
Software developer Ward Cunningham coined the financial analogy of technical debt to explain this dynamic. Borrowing time to release faster is a perfectly acceptable business strategy, but you incur interest on that loan.
You must pay down the principal through regular software maintenance. If you fail to do this, the compounding interest eventually paralyzes the engineering team. Every new feature requires modifying fragile code, so the cost of future changes becomes prohibitively expensive.
Unmanaged debt inevitably causes critical missed delivery targets. A VP of Engineering might commit to a Q3 product launch based on current team capacity. But technical drag from a legacy billing module quickly causes endless pull request churn.
Developer productivity plummets as engineers spend weeks untangling fragile logic instead of building new capabilities. The result is severe system instability and missed business outcomes. Slower feature releases give competitors the advantage and directly impact revenue pacing.
Engineering leaders categorize tech debt by analyzing the intent behind the decision and the context in which it occurs. This framework helps teams distinguish between strategic technical tradeoffs and simple carelessness.
This occurs when a team explicitly knows the right way to build a feature but chooses the wrong way just to meet short-term deadlines. They might hardcode values or skip essential automated testing entirely.
The team makes these technical tradeoffs without any plan to fix the underlying issues later. This behavior signals a toxic engineering culture and guarantees future delivery failures.
Strategic leaders use this category as a calculated business lever. A team might choose a monolithic architecture over microservices to test a minimum viable product and accelerate time-to-market.
The leadership team understands the limitations and actively schedules future sprints to pay down the debt once the product proves its value. This approach aligns engineering efficiency directly with positive business outcomes.
This debt accumulates when teams simply don't know any better. A junior engineering team might build a complex feature without understanding the design patterns required to scale it.
The resulting code is sloppy and introduces massive operational overhead. Leaders must address this through better training, stricter review processes, and improved engineering efficiency standards.
Even the most talented teams accumulate this debt over time. You might build a brilliant system using the best available practices, but industry standards evolve and user demands shift two years later.
The original design no longer fits the current reality. This impacts codebase health and turns previously modern applications into legacy systems. The result is rising pull request churn as engineers struggle to adapt the old code to new requirements.
The rapid adoption of AI coding assistants fundamentally changes how organizations accumulate risk. AI tools allow developers to generate thousands of lines of code in seconds, so this massive spike in output creates a severe bottleneck downstream.
Human reviewers can't match the pace of the machine. AI doesn't necessarily write bad code, but it dramatically increases code complexity. Developers often accept AI suggestions without fully understanding the underlying logic, and this introduces hidden vulnerabilities.
This dynamic forces human reviewers to spend days deciphering convoluted pull requests. The operational overhead skyrockets, and codebase health deteriorates rapidly. You can't solve this modern friction with legacy metrics.
Engineering leaders can't fix every imperfect line of code. You must treat technical debt reduction as an ongoing resource allocation exercise. According to a 2022 McKinsey report, developers spend approximately 30% of their time managing technical debt1. A 2018 Stripe Developer Coefficient study found that engineers lose up to 17 hours a week to software maintenance and bad code2.
You can't afford that level of waste, so you need a systematic approach to identify which infrastructure debt actually threatens your business. Use this step-by-step guide to evaluate and prioritize your refactoring efforts:
You might track a drop in sprint velocity, but that metric alone doesn't reveal the root cause of the slowdown. A common leadership mistake is tracking metrics without contextualizing the underlying workflow bottlenecks.
A single complex pull request can cause severe code review delays, which blocks multiple engineers and creates a cascading delay across cross-team dependencies. You must perform a root cause analysis to understand exactly where the friction lives. Connecting code complexity directly to cycle time delays gives you the objective data needed to prioritize fixes before they derail your release schedule.
Engineering leaders struggle to justify debt to non-technical stakeholders because they lack objective data connecting code quality to business outcomes. Fragmented data across Jira and GitHub erodes trust in the boardroom. You are left relying on intuition rather than concrete signals to defend your resource allocation.
Standard frameworks and Agile methodologies provide signals of a slowdown, but they don't provide an understanding of the underlying causes when operating at scale. To properly evaluate operational friction and justify refactoring, leaders must implement an operational intelligence layer.
TargetBoard is an agentic operational intelligence platform that helps leadership teams understand how execution is performing, why it is changing, and how to respond. It connects data across company systems, interprets performance through operational intelligence, and uses domain-expert AI agents to guide execution decisions.
Everyone who touches the product lifecycle shares responsibility for it. Product managers create debt when they push unrealistic deadlines without consulting engineering constraints. Developers create it when they skip technical documentation or ignore established coding standards.
Leadership ultimately owns the debt because they control the culture and the budget. You must foster an environment where engineering efficiency balances perfectly with speed to market. When you treat debt as a shared business reality, teams can openly discuss tradeoffs without fear of blame.
You can't walk into a board meeting and ask for a month to clean up bad code. You must frame the initiative around risk mitigation and delivery tradeoffs. Follow this step-by-step guide to build a compelling executive case:
Understanding these patterns gives you a clear framework for your next resource planning session. You no longer have to wait for a major outage to address technical entropy. You can monitor codebase health continuously and catch bit rot before it impacts your customers.
Start by auditing your current reporting systems to see if they actually explain why performance is changing. Move away from manual data aggregation and implement an intelligence layer that connects code complexity to delivery outcomes. This shift allows you to stop reacting to delayed releases and start driving predictable execution across your entire engineering organization.
.png)
Code churn refers to the percentage of a developer's code that gets rewritten, modified, or deleted shortly after being written. Teams typically measure this within a strict 3-week timeframe. If an engineer writes a function and rewrites it two days later, that action is code churn.
When you ask what is code churn, the answer lies in your version control systems. These systems track the exact lines added, modified, and deleted before code reaches production. High churn over a short period indicates that the code was not stable upon its first commit.
You calculate churn code by dividing the number of lines modified or deleted within a specific period by the total number of lines added during that same period. You then multiply the result by 100 to get a percentage.
Here is how you calculate code rework step by step:
Keep in mind that commit frequency alone doesn't equal churn. A developer might commit frequently to save progress without rewriting the same lines of code.
Code churn isn't inherently bad. It is a natural part of the software development lifecycle. The goal is not to eliminate it, but to differentiate healthy prototyping from destructive rework.
Healthy churn happens during the initial design phase when engineers iterate on complex problems. Destructive rework happens when developers constantly rewrite code due to unclear requirements or accumulating technical debt. This unhealthy behavior creates workflow bottlenecks that delay delivery.
Consider a scenario where a team is updating an aging payment gateway. Working with legacy code naturally requires trial-and-error coding. A developer submits a pull request, and the reviewer requests multiple architectural changes because the original product requirements were vague.
The developer spends the next four days rewriting the same 500 lines of code. This is review churn. It isn't a developer defect, but a systemic issue caused by poorly defined upstream requirements. The engineering effort is wasted, so the entire sprint slows down.
A 5% churn rate is exceptionally low and generally indicates a highly stable, well-understood codebase. Industry research from LinearB1 suggests that a healthy churn threshold sits around 20% for most engineering teams. Appfire2 confirms that exceeding this limit often points to systemic process failures rather than individual coding errors.
But a single baseline doesn't apply universally. A team building a new product from scratch will naturally see higher churn than a team maintaining an established application. You must establish a baseline based on historical engineering metrics for each specific project. If a team's baseline is 15% and it suddenly spikes to 40%, you have a clear signal that sprint velocity is about to drop.
A sudden spike in code rework is a symptom of a deeper operational failure. You must perform a root cause analysis to understand why engineers are rewriting their work. If you ignore the underlying issues, you will see an increase in software bugs and a massive slowdown in cycle time.
Common drivers of destructive rework include:
Last quarter, a core delivery team saw their pull request review churn spike by 40%. The dashboard highlighted the developers as the problem, but the real issue was shifting requirements from product management. The developers were building features based on vague tickets.
When reviewers finally saw the code, they requested massive architectural changes to align with the actual business goals. These communication breakdowns force developers to rewrite working code. This constant rework inevitably leads to developer burnout and severely damages your overall delivery predictability.
Engineers sometimes dive into a problem without a clear architectural plan. This trial-and-error coding results in massive rewrites before the code even reaches the review stage. The issue often stems from failing to apply SOLID design principles early in the process.
When code complexity is high, every new addition breaks existing functionality. Developers have to constantly rewrite their logic to force the new code to fit. You can fix this by enforcing technical design documents before any coding begins.
Avoid using code churn as an individual performance punishment tool because high churn is a systemic workflow diagnostic rather than a developer defect.
You can identify these bottlenecks by tracking your workflow behavior through these steps:
Generative AI is fundamentally altering how software is built. AI coding tools increase raw output, but they often severely bog down review cycles. Developers can generate hundreds of lines of AI-generated code in seconds. This creates an illusion of high productivity.
But this code often contains hidden complexity and massive code duplication. Reviewers have to spend hours untangling the logic, and they frequently force the original developer to rewrite the entire section. This drives up your review churn and creates a massive bottleneck.
Industry frameworks like DORA metrics are excellent tools for measuring engineering performance. They provide valuable signals about speed and reliability. But these metrics only tell you that your cycle time dropped or your defect rate increased. They don't tell you why the change happened.
To manage the influx of AI-generated code and protect your delivery predictability, you need more than passive reporting. You need an operational intelligence layer that connects codebase health directly to delivery risk.
TargetBoard is an agentic operational intelligence platform that helps leadership teams understand how execution is performing, why it is changing, and how to respond. It connects data across company systems, interprets performance through operational intelligence, and uses domain-expert AI agents to guide execution decisions.
This continuous intelligence allows you to differentiate between human-written and AI-generated code churn. You catch delivery risk before it gets merged, ensuring your execution stays aligned with your planning.
You can't improve what you don't understand. When you reduce destructive rework, you directly improve your delivery predictability. Teams stop wasting engineering effort on endless review cycles and start shipping reliable features on time.
You must stop treating engineering metrics as a retroactive scorecard. Delivery failures are system issues rather than developer defects. You need to use operational intelligence to catch workflow bottlenecks in real time. This approach restores trust in your reporting and gives you the confidence to allocate resources effectively.
Change failure rate (CFR) measures the percentage of code deployments that result in a failure in production. The goal is to track how often your team pushes code that requires immediate remediation.
This metric serves as a critical counterbalance to deployment frequency. Optimizing strictly for speed often damages quality, so tracking failures ensures your team maintains system stability while shipping features faster. Engineering leaders use this DORA change failure rate signal to balance the inevitable tradeoff between quality versus speed.
Calculating this metric requires standardizing what counts as a deployment and what counts as a failure. You must define these terms consistently across your incident response tools and code repositories.
To calculate change failure rate, use this formula:
(Number of Failed Changes / Total Number of Changes) × 100
Industry benchmarks categorize engineering teams into performance tiers based on their ability to ship code reliably. According to the 2023 Accelerate State of DevOps Report by Google Cloud, you can measure change failure rate against these established standards to gauge your baseline delivery health.
Most engineering leaders limit the definition of failure strictly to hotfixes and rollbacks. This narrow scope misses the broader picture of system degradation.
If a deployment introduces massive technical debt or causes degraded service that doesn't trigger a critical alert, your dashboard will still show a success. This forces leaders to rely on intuition because incomplete data undermines the credibility of engineering reporting. Redefining failure for the modern era means looking at the entire workflow rather than just the final production state to capture the true cost of service patches.
Modern software delivery systems experience friction long before a catastrophic outage occurs. You must expand your definition of failure to capture the hidden costs of code delivery.
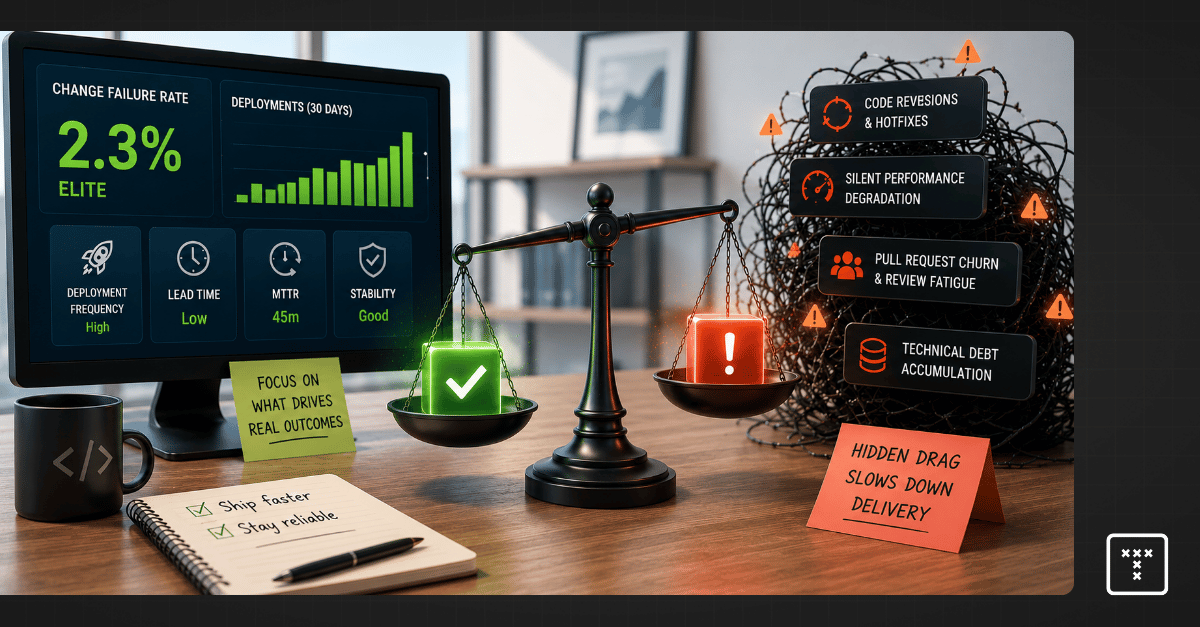
A dashboard can easily show an Elite status while your team is actually dealing with high pull request churn. This happens when teams game the metric or pollute the data with inconsistent definitions.
One common mistake is including fix-only deployments in the denominator of your calculation. If you push five hotfixes to resolve a single incident, counting those fixes as new deployments artificially lowers your failure rate. Another pitfall involves poor incident attribution, where third-party cloud outages are counted against internal team performance. These practices create a false sense of stability that operational intelligence must correct to restore trust in your reporting.
Executives must ensure their teams map incidents accurately across the software delivery lifecycle. Messy data makes it impossible to identify root causes and delays critical decision-making.
The rapid adoption of AI coding tools fundamentally changes how we measure delivery risk. These tools drastically increase developer output, so teams write and submit code faster than ever before. Yet this sheer volume of artificial intelligence-generated code contributions introduces unseen complexity into your repositories.
Downstream reviewers simply can't keep up with the flood of new pull requests. This imbalance creates severe review fatigue, where engineers lose the capacity to deeply inspect code for architectural flaws or long-term maintainability issues. The code compiles and passes basic tests, but the underlying structural health of the system degrades quietly.
Unmanaged complexity builds up in your repositories and creates massive workflow friction during the review stage. When a dense, highly complex pull request sits in review for days, engineers eventually rubber-stamp the approval just to clear their queues.
That code merges, sits in the pipeline, and fails days later in production. You then spend valuable engineering cycles on bug prioritization instead of shipping new features. The failure looks like a sudden event on your dashboard, but the root cause was the hidden complexity that bottlenecked your workflow days earlier.
Measuring a failure after it hits production is fundamentally a lagging indicator. Industry frameworks provide useful signals about your software delivery performance, but they don't provide an understanding of why that performance is changing. You need to know where risk enters your system before the code ships to production.
TargetBoard is an agentic operational intelligence platform that helps leadership teams understand how execution is performing, why it's changing, and how to respond. It connects data across company systems, interprets performance through operational intelligence, and uses domain-expert artificial intelligence agents to guide execution decisions.
By surfacing hidden risks like review fatigue, code anomalies, and workflow bottlenecks during the actual code review process, TargetBoard allows you to neutralize the root causes of failure before they merge. This shifts your posture from reactive reporting to proactive delivery confidence, ultimately driving true engineering efficiency.
You can actively prevent production failures by changing how your team handles code before it reaches the main branch. Aligned with the foundational Continuous Delivery principles established by industry experts like Jez Humble and Martin Fowler, shifting quality checks left is critical.
Pushing for speed without guardrails creates severe systemic tradeoffs. You must balance how fast you ship with how well your system actually runs.
Requires connecting cross-system data to accurately predict where failures will occur.
Redefining failure requires you to look beyond standard production deployments and measure the friction happening inside your daily workflows.
Your dashboard is only as valuable as the decisions it enables. Passive metrics show you what broke, so you must adopt active operational intelligence to see why it broke. Understanding these patterns gives you a clear framework to improve engineering efficiency and ensure long-term delivery predictability. Moving away from lagging scorecards allows you to scale your software delivery performance safely and build trust with your board.

.webp)