Most AI coding tools can tell you whether they are being used.
You may be able to track active users, adoption rates, suggestions, acceptance rates, generated code, token consumption, or AI-assisted activity.
That information is useful, but it does not tell you whether engineering performance improved.
Consider two teams that both significantly increase AI adoption.
Both teams can report successful adoption.
Only one is showing clear evidence of better engineering outcomes.
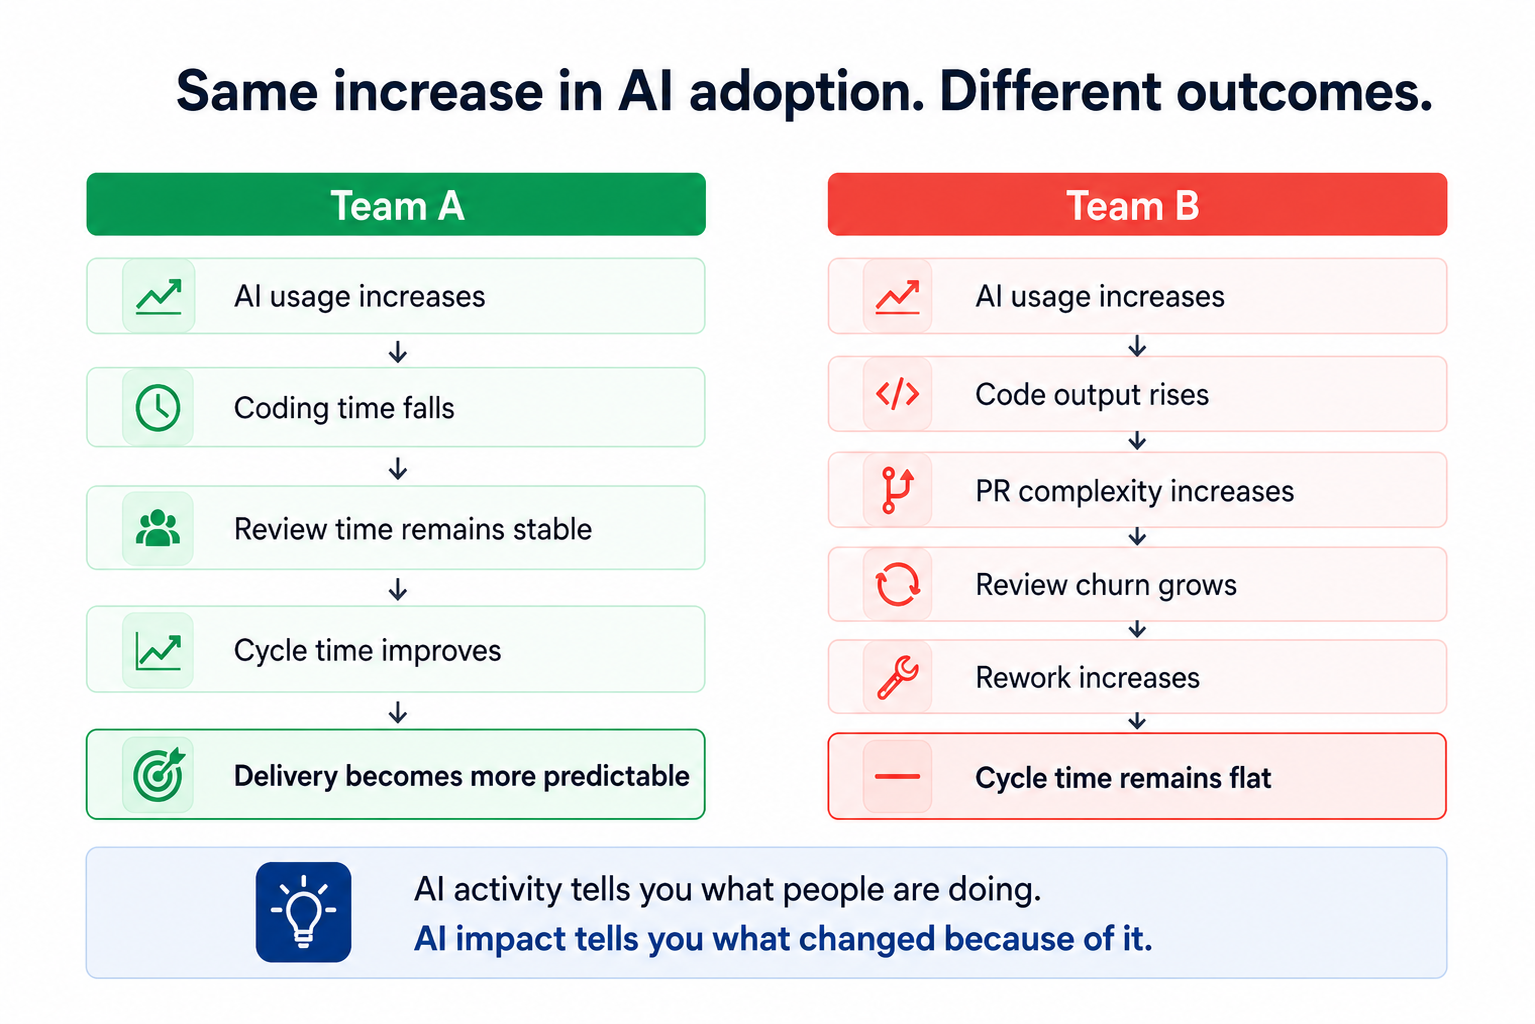
The mistake is jumping directly from adoption to ROI.
High usage does not automatically mean higher productivity, better delivery, or financial return. A more useful model is:
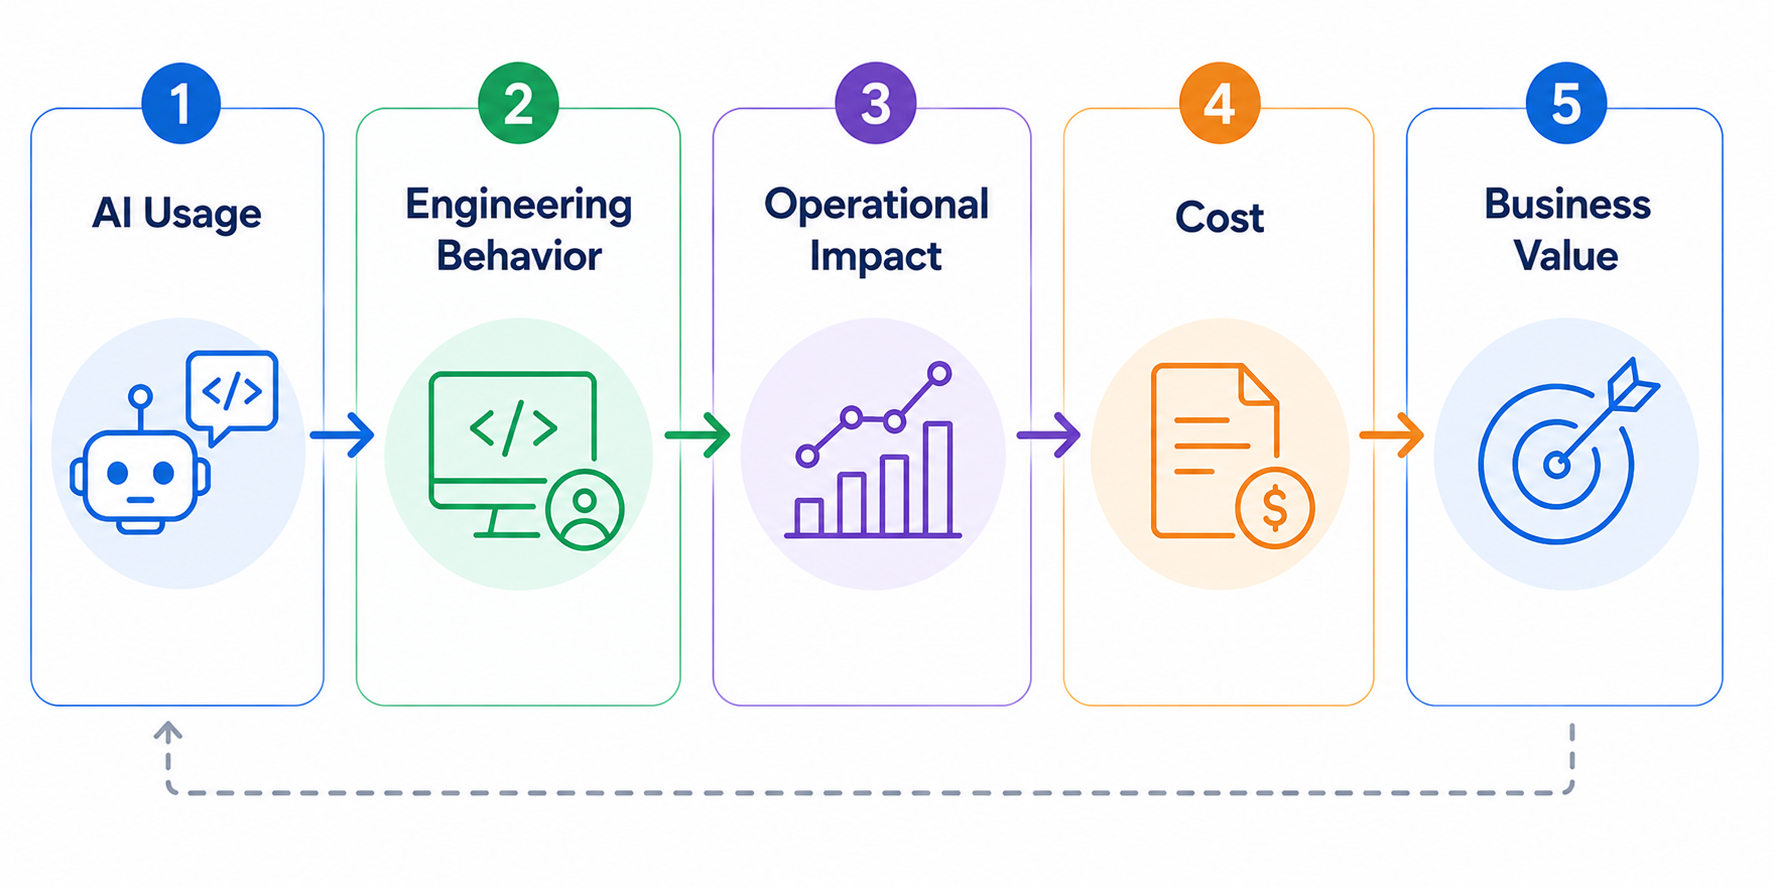
AI may reduce coding time but increase review effort.
It may increase throughput while also increasing rework.
It may deliver significant benefits to one team and almost none to another.
The useful question is not: “How much AI are we using?”
It is: “What happened to engineering performance where AI usage changed?”
Most organizations are not missing the underlying data.
The problem is that each system understands only its own part of the world.
A Cursor usage event does not know what initiative the developer was working on.
A GitHub pull request does not automatically know whether it was AI-assisted.
A Jira ticket does not understand what happened during code review.
An AI license does not tell you if the team using it became more productive.
Take a seemingly simple leadership question:
Answering it reliably may require you to:
Any one of these tasks is manageable.
The complexity comes from keeping all of them correct together.
Teams reorganize. Repositories move. Jira workflows change. AI vendors change. APIs evolve. New leadership questions appear.
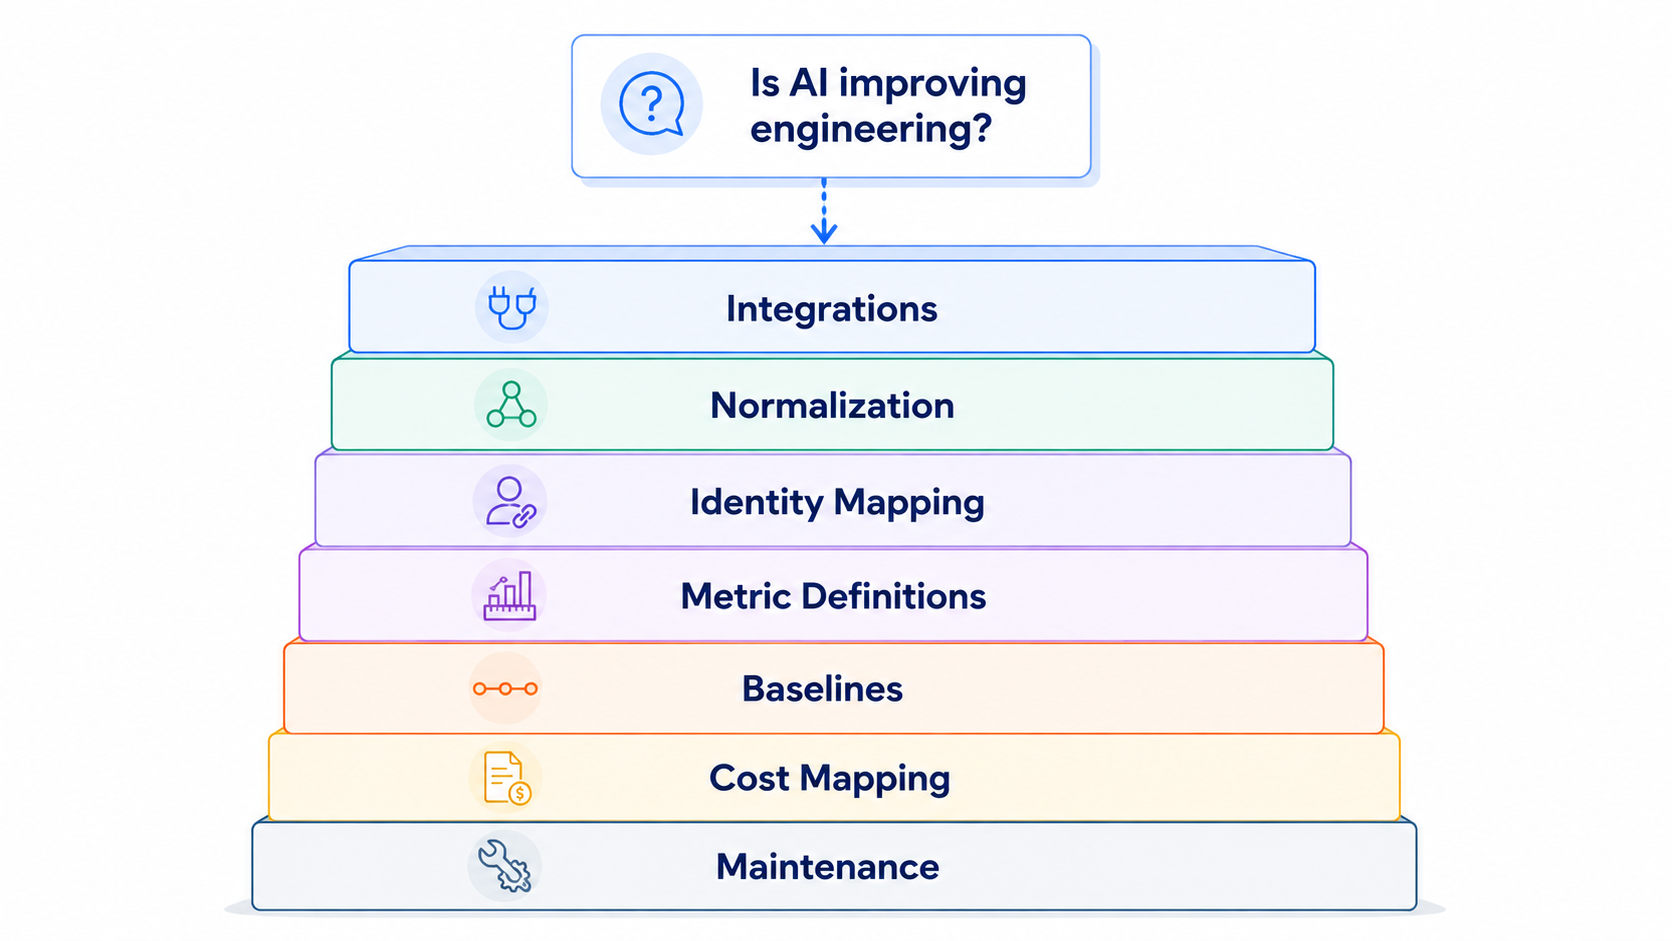
Most engineering organizations have the technical capability to build internal analytics.
APIs, warehouses, transformation tools, BI platforms, internal engineering teams, and increasingly capable AI models are all available.
The question is not whether you can build it.
It is what you want to own.
There is a big difference between connecting Jira and GitHub for a dashboard and maintaining a reliable operational model of the engineering organization.
That model needs to understand relationships between:
And those relationships need to remain accurate as the organization changes.
The internal solution therefore comes with ongoing ownership of connectors, schemas, metric governance, organizational mappings, historical consistency, tool migrations, and analytical logic.
The more useful build-vs-buy question is:
For some organizations, the answer may still be yes.
But it should be a deliberate decision.
A pull request alone can tell you its size, review time, comments, churn, and merge time. Add company context and you can also understand:
That changes the questions leadership can ask.
That is the difference between aggregating engineering data and understanding engineering performance.
Connecting the data still leaves one problem: interpretation.
A dashboard may tell you cycle time increased 18%.
Leadership still needs to determine:
Traditional reporting shows the metric.
Someone still has to explain it.
The next evolution of engineering analytics therefore cannot simply be:
more systems → one dashboard
It needs to be:
Engineering leaders need to understand what changed, what is driving it, and where action is required.
TargetBoard connects data across engineering, planning, AI, organizational, quality, cost, and other company systems while allowing teams to continue working in their existing tools.
That data is normalized into a consistent company context that preserves relationships between people, teams, repositories, work, initiatives, delivery, and outcomes.
On top of that context, domain-expert agents continuously interpret performance to surface what changed, what is driving it, and where risk or opportunity is emerging.
That enables engineering leaders to investigate questions such as:
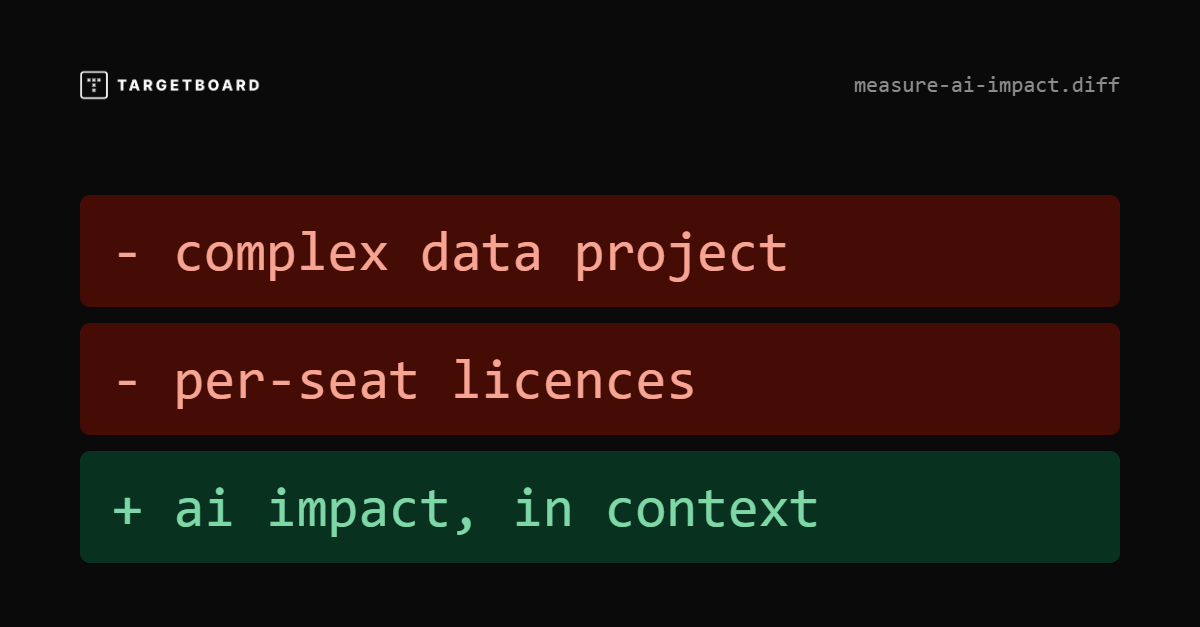
The goal is not another dashboard. It is removing the data engineering and interpretation work standing between the question and a reliable answer.
AI coding assistants are individual-use tools, so per-seat pricing makes sense.
Engineering intelligence is different.
Its value comes from understanding the organization as a system. A developer does not need to log into an analytics platform for their work to contribute to the operational picture leadership needs.
TargetBoard does not use per-seat pricing.
The objective is organization-wide engineering and AI intelligence, not another product that has to be licensed developer by developer.
Measuring AI impact is technically solvable. The question is how much infrastructure your engineering organization wants to own in order to solve it.
If you build the capability internally, the commitment extends well beyond connecting a few APIs or creating a dashboard. Someone needs to maintain the data model, keep identities and organizational mappings accurate, absorb changes in source systems, preserve historical consistency, and continually adapt the analysis as new AI tools and new leadership questions emerge.
For organizations with highly specific requirements, that investment may be justified.
But for most engineering leaders, the more useful question is whether building and maintaining this measurement layer creates any strategic advantage.
The value is not in owning the pipelines.
It is in being able to answer, with confidence:
Those are management questions, not data-engineering outcomes.
The goal should be to spend less time assembling the evidence and more time using it to make better engineering decisions.
.png)
Most vendor evaluations combine a product demo, a limited developer trial, feature comparisons, and user feedback.
These inputs can show whether a tool is usable, trusted, secure, and compatible with the existing toolchain. They do not establish whether it improves delivery.
A developer may feel faster while using an AI assistant, yet pull requests may still require more review, create more rework, or spend longer waiting to be picked up.
Developer sentiment provides valuable context. Operational data shows what actually changed.
This distinction is particularly important for AI engineering tools. Faster code creation does not automatically lead to faster review, approval, or deployment. A tool may accelerate one stage while moving friction further downstream.
The customer wanted to compare two AI code review automation vendors: Qodo and CodeRabbit.
Rather than testing the tools with unrelated groups or comparing broad company-wide averages, the team used the same defined group of developers throughout the evaluation. Each vendor was tested during a separate period of approximately two weeks.
The methodology was straightforward:
This was not a laboratory experiment. Real engineering environments include differences in repository complexity, work type, team availability, and pull request size.
But it was a structured, real-world comparison that produced stronger evidence than a feature checklist or a collection of opinions.
The objective was not to prove that one vendor is universally better. It was to determine which vendor produced better outcomes in this customer’s environment.
The analysis depended on consistently isolating the developers participating in the POC.
Without a reusable filter, the team would have needed to rebuild the participant group for each metric and evaluation period, slowing the process and increasing the risk of inconsistent comparisons.
Using TargetBoard Saved Filters, the team defined the relevant contributors and pull request creators once, then reused the same cohort across the board.
This made it easier to:
The team could spend less time configuring the analysis and more time interpreting the results.
The customer focused on what happened after code entered the pull request workflow.
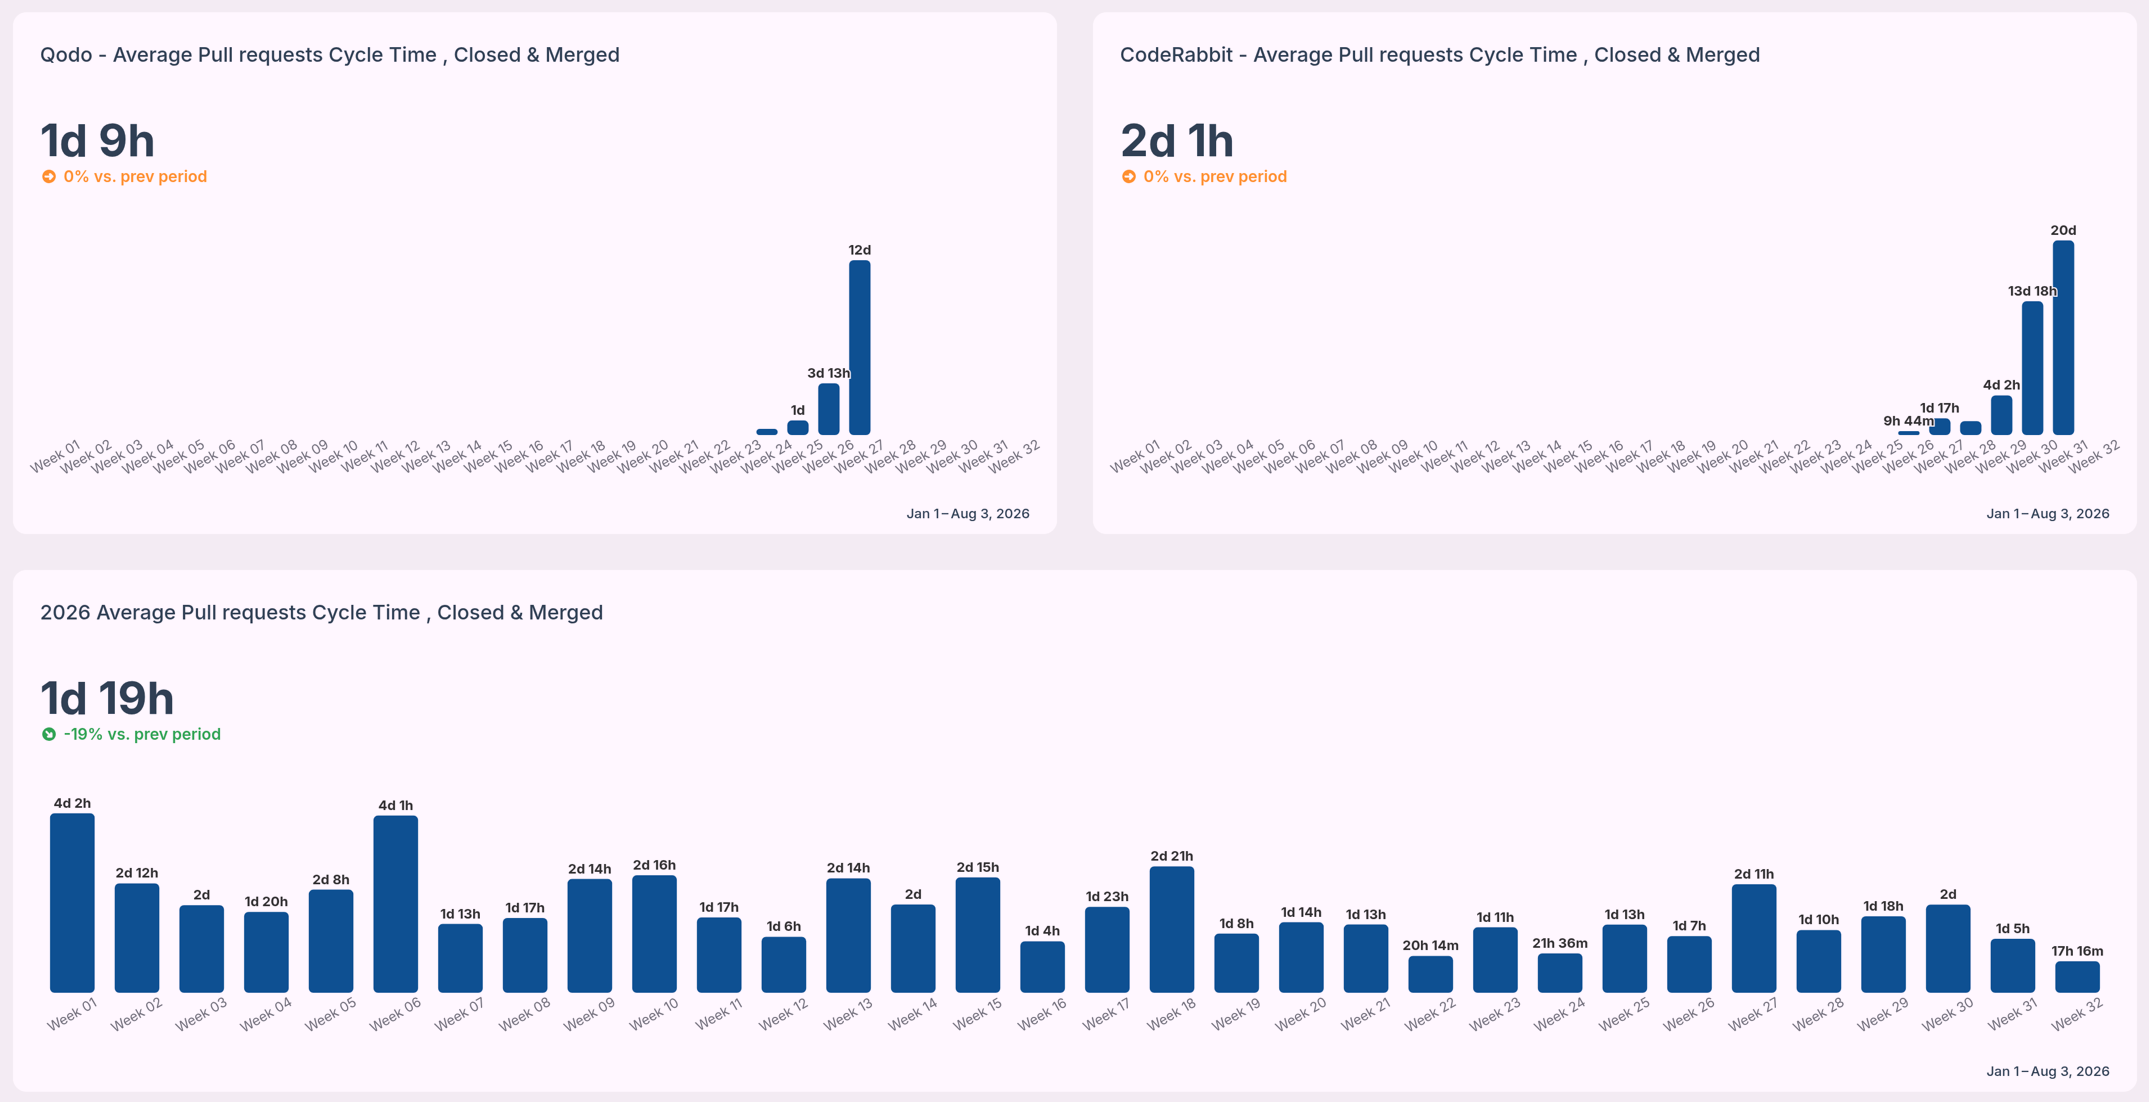
This measured the time from the first commit until the pull request was merged.
It provided an end-to-end view of whether work moved more efficiently during each vendor trial. In this evaluation, the Qodo period showed a shorter average cycle time than the CodeRabbit period.
Cycle time should be treated as a system signal. A higher result may reflect delays in pickup, review, coordination, approval, or integration.
The team also measured how many times a pull request returned to the author for changes before approval.
Fewer review cycles can indicate less back-and-forth and lower review churn. The Qodo period showed fewer average review cycles than the CodeRabbit period.
This was useful evidence, although a full quality assessment would also need to consider defects, incidents, rollbacks, and escaped issues.
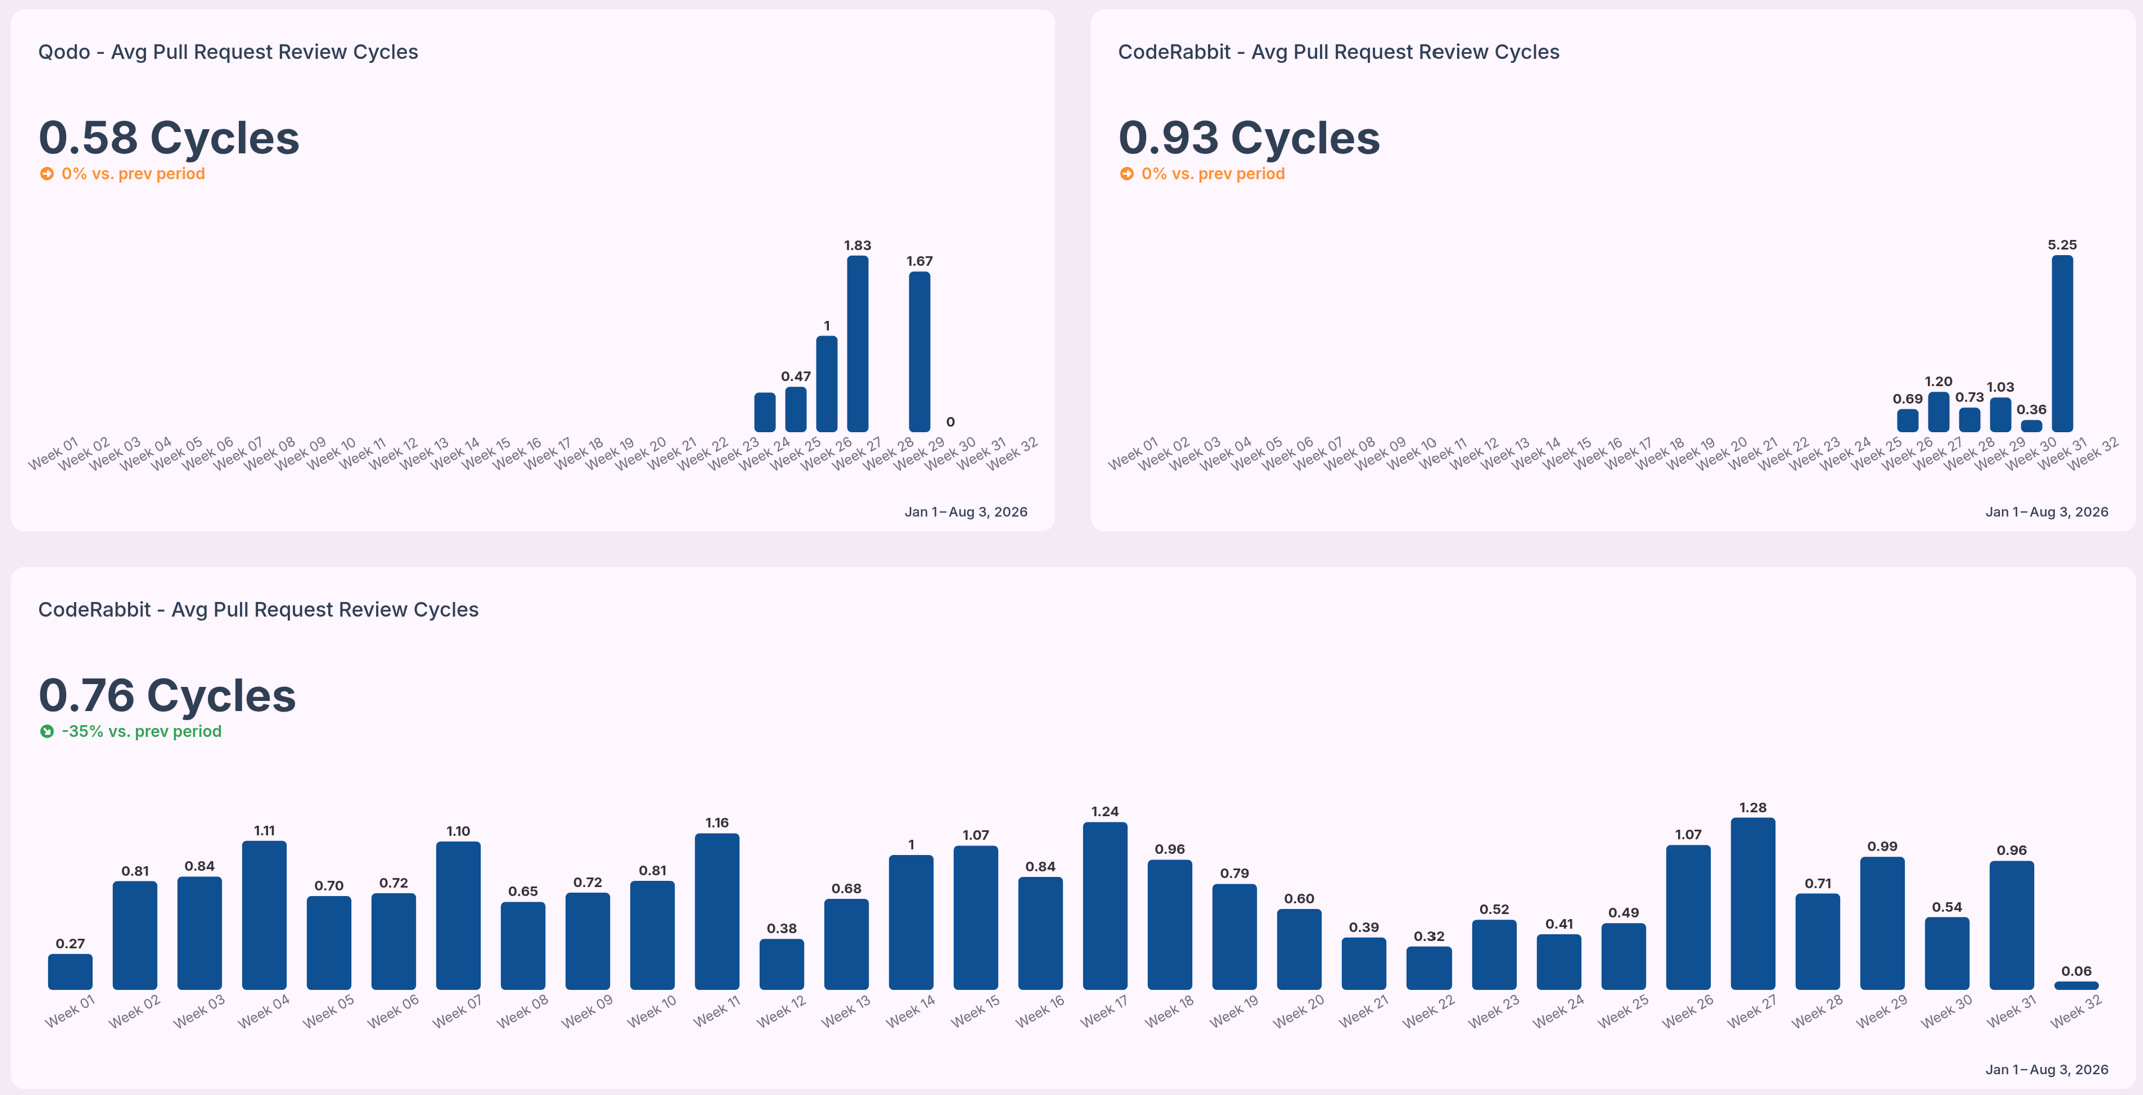
Overall cycle time shows that a difference exists. It does not explain where the delay occurred.
The customer therefore examined time spent in stages such as coding, waiting for review, active review, and merge.
This helped distinguish active work from waiting time and showed whether differences came from review pickup, review complexity, or later workflow stages.
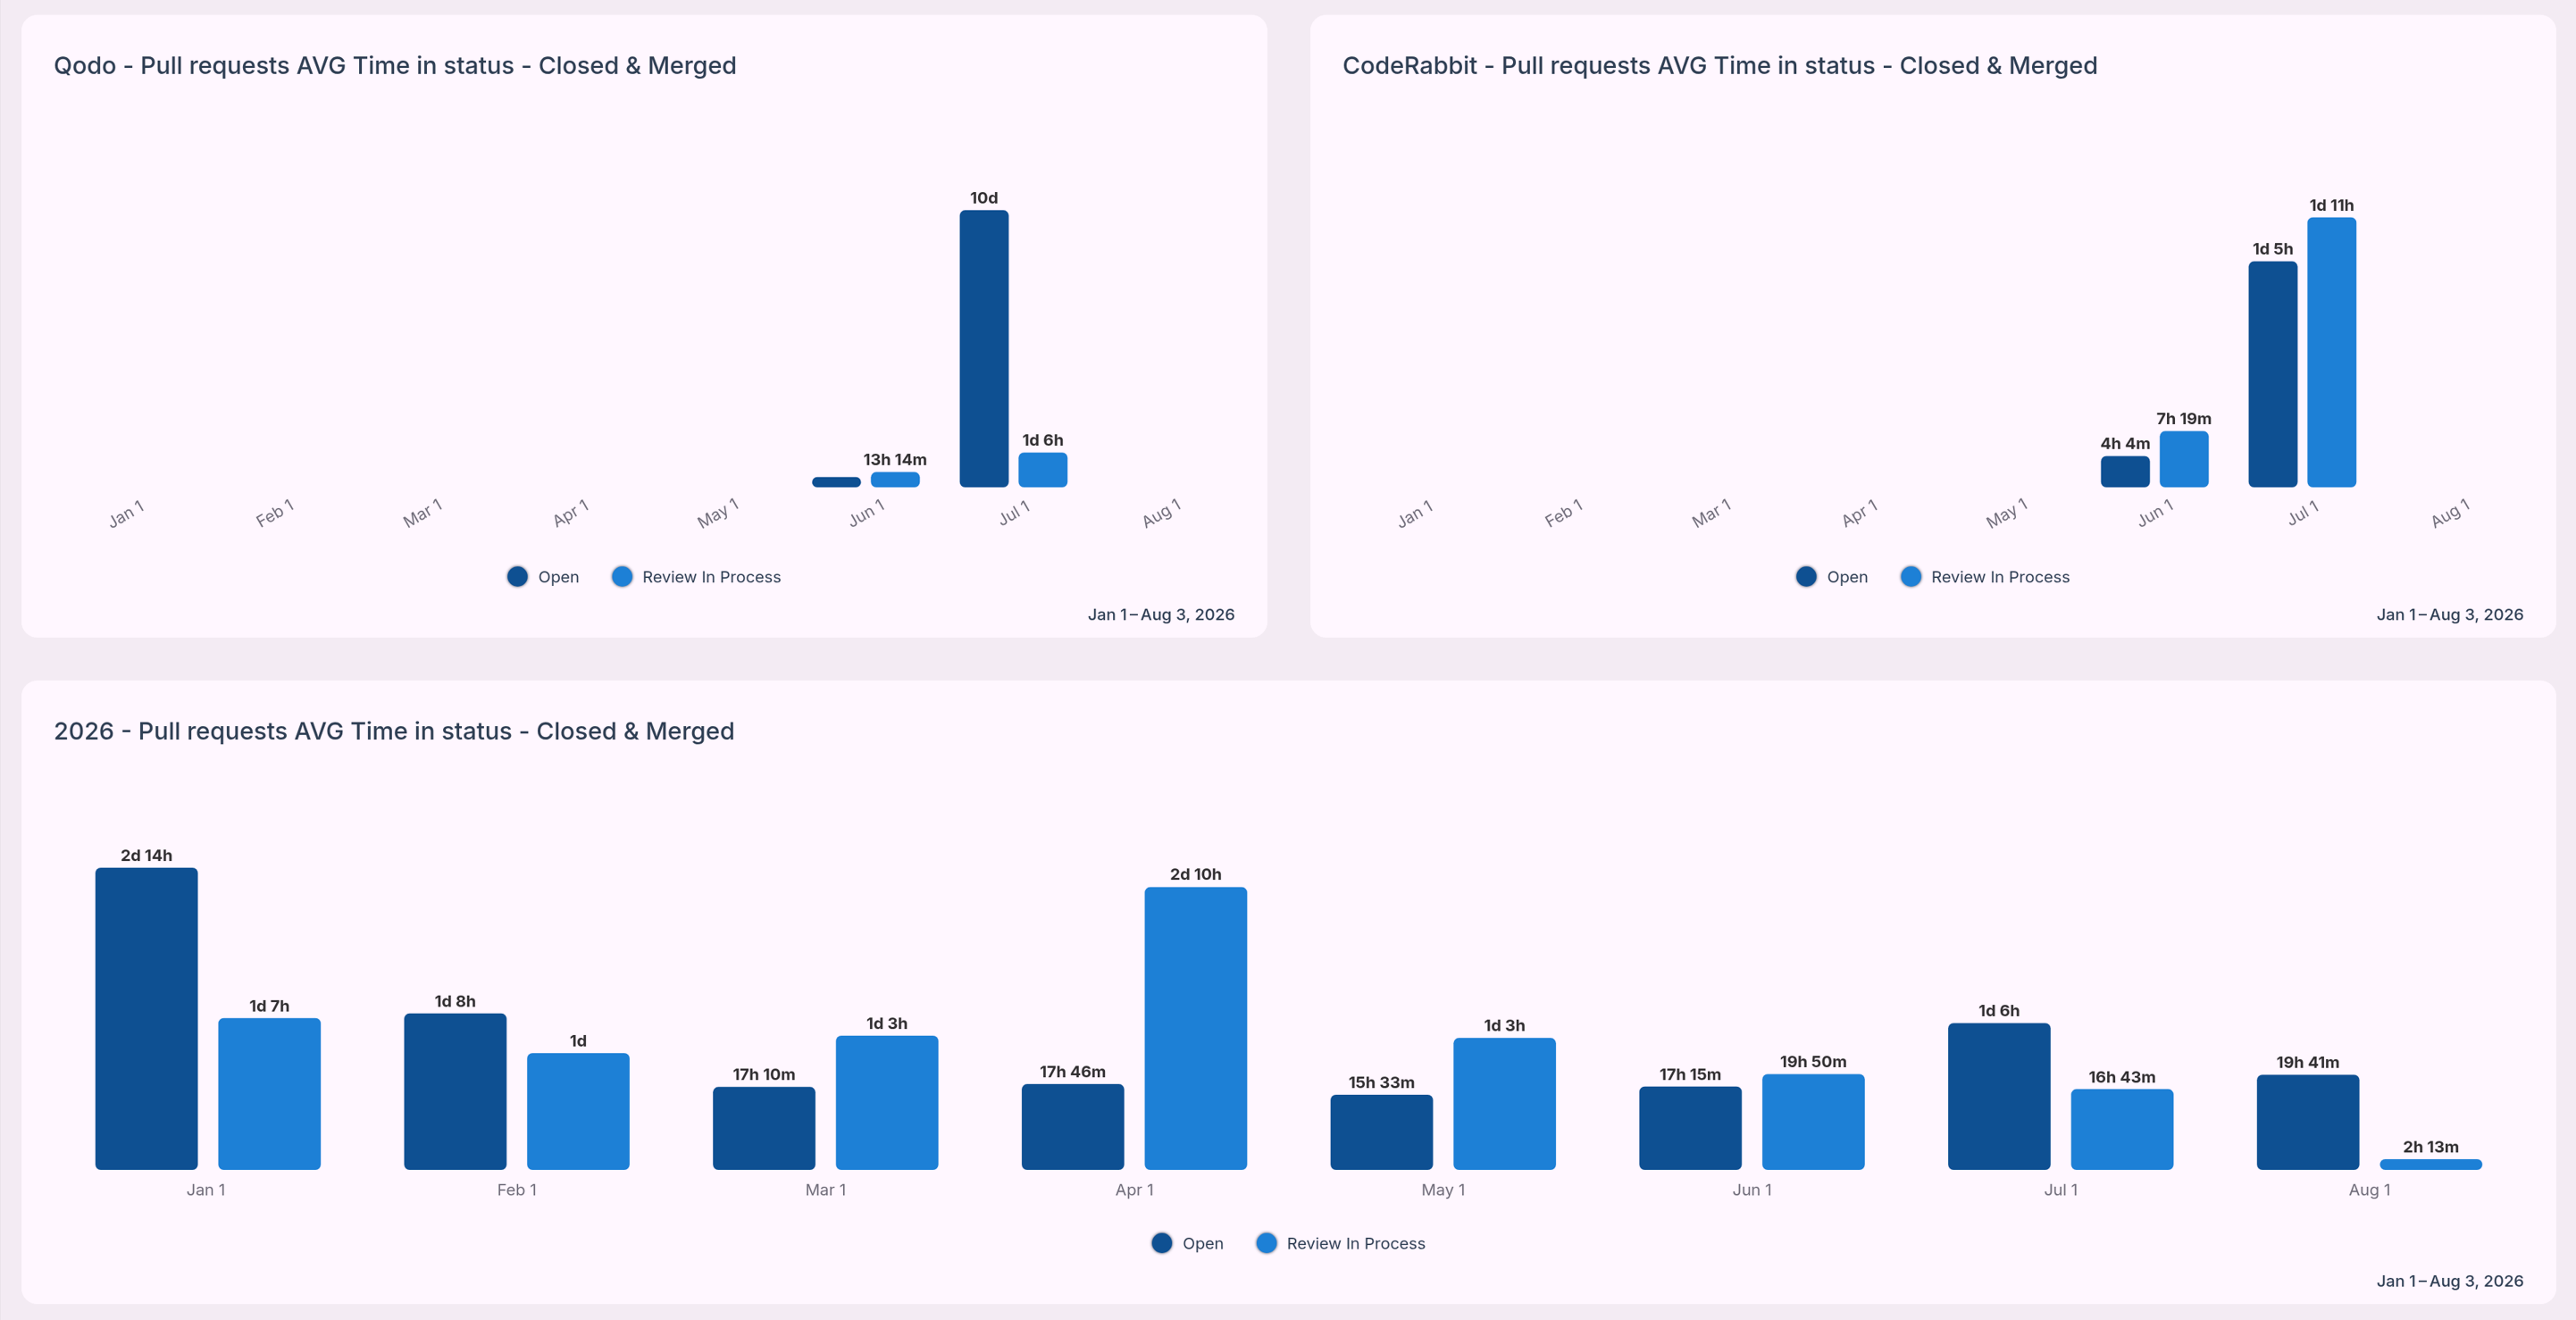
Across the metrics selected for the proof of concept, the Qodo evaluation period showed stronger results than the CodeRabbit period.
The Qodo period recorded:
These results gave the customer a concrete basis for the selection decision.
The team was no longer deciding only which product looked more capable in a demonstration or which tool developers preferred. They could compare how each vendor affected real work inside their engineering system.
The result should remain specific to this customer. It does not establish a universal benchmark for either vendor. The outcome reflected the organization’s developers, repositories, processes, work mix, and evaluation periods.
That limitation does not weaken the analysis. It is what makes the result useful.
The customer needed to know which vendor performed better in its own environment.
A useful AI vendor POC should answer two questions: “Which tool did developers prefer?” and “What changed in the delivery system when the tool was introduced?”.
To build a stronger evaluation:
No single metric should decide the outcome.
A tool may reduce review time while increasing quality risk. Another may receive strong developer feedback but show little measurable effect on delivery. A complete evaluation balances operational outcomes with usability, risk, and cost.
AI engineering vendors should be evaluated on more than features, adoption, and perceived time savings.
The real question is whether a tool improves the flow, quality, and predictability of software delivery.
By testing Qodo and CodeRabbit with a defined group of developers, applying consistent operational metrics, and using TargetBoard Saved Filters to accelerate the analysis, this customer turned a typical POC into a more defensible purchasing decision.
The result was not simply another dashboard. It was a clearer understanding of what changed, where the differences appeared, and which vendor produced the stronger outcome for that organization.
TargetBoard helps engineering leaders compare vendor performance using operational data from their own teams and workflows.
See how TargetBoard can help you build a more objective, repeatable vendor evaluation process.
An ai code review is the process of using Large Language Models to automatically analyze pull requests. These tools scan source code analysis outputs to detect syntax errors and suggest refactoring options before a human reviewer steps in. They excel at identifying boilerplate code issues and enforcing standard automated linters. But they struggle with cross-service dependencies and complex business logic constraints.
The most effective engineering teams treat an ai code reviewer as a high-speed assistant rather than an autonomous decision-maker. AI models lack the operational context to make final architectural decisions. They can't negotiate API contracts or understand why a specific workaround exists for a legacy system.
That means a human-in-the-loop review remains absolutely critical. You use the AI to clear out the noise of code formatting and basic threat detection, so your senior engineers can focus their cognitive energy on system design and business logic.
A major limitation of current AI tools is their reliance on file-level analysis. An AI assistant might review a single pull request and confirm the syntax is perfect. Yet that same code might break cross-service dependencies three layers deep in your application.
This happens because AI context windows face strict VRAM limits and memory constraints, preventing them from holding your entire codebase in memory at once. Trusting AI file-level analysis without verifying the broader repository context is a common mistake that leads directly to architectural drift. Your delivery pipeline must connect code changes to system-wide impacts to prevent this risk.
Yes, a code review ai is highly accurate when evaluating isolated syntax and standard formatting rules. Conversely, accuracy drops to near zero when evaluating complex logic or proprietary frameworks. This drop in precision introduces high rates of false positives and AI hallucinations into your pull requests.
Consider a common scenario where an AI tool successfully identifies a missing variable declaration but completely misses a breaking change in your core payment processing logic. The AI then floods the pull request with dozens of comments about stylistic formatting. Developers end up arguing with an AI bot in the comments over subjective syntax choices, creating massive review churn.
This noise creates an overwhelming backlog for human reviewers and actively slows down sprint velocity. Developer overreliance on these tools compounds the problem. Junior engineers might blindly accept AI suggestions without understanding the underlying code, injecting hidden technical debt into the system. You must measure this friction continuously to ensure the tool is actually accelerating your workflow rather than just generating noise.
Selecting the best ai code review tools requires matching the platform's core capability to your specific workflow bottleneck. You must differentiate between tools that generate code, platforms that scan for vulnerabilities, and systems that measure the systemic impact of those changes.
Tools like CodeRabbit and Qodo focus heavily on pull request summarization. They read the diff and generate a plain-language summary of the changes, so human reviewers can grasp the intent faster. This approach often improves initial time-to-merge metrics for simple tasks.
But open source ai code review tools in this category can struggle when deployed on massive enterprise monorepos. The sheer volume of interconnected files overwhelms the model. This leads to generic summaries that fail to capture the actual architectural impact of the change.
GitHub Copilot and similar IDE extensions operate directly where developers write code. These tools use agentic workflows to suggest entire functions as the developer types. They are incredibly effective at reducing the time spent writing boilerplate syntax.
They operate with a limited view of the broader system. A native extension might suggest a highly efficient sorting algorithm, yet it can't verify if that logic violates broader API contracts established by another team. Human reviewers must still validate those systemic connections.
Enterprise platforms like SonarQube and Greptile focus on strict CI/CD integration. They run deep static analysis to ensure your codebase maintains OWASP compliance and prevents known vulnerabilities from reaching production. These tools are non-negotiable for teams operating in highly regulated environments.
A major consideration in this category is data sovereignty. Sending proprietary enterprise code to external models for security scanning introduces compliance risks. You must configure these tools to ensure sensitive data remains within your controlled infrastructure.
Adopting ai powered code review tools frequently increases raw output while secretly damaging delivery predictability. You need a way to measure this friction. TargetBoard is an agentic operational intelligence platform that helps leadership teams understand how execution is performing, why it is changing, and how to respond.
TargetBoard connects data across company systems and uses domain-expert AI agents to understand workflow bottlenecks. It acts as the essential operational intelligence layer that shows you if your AI coding tools are actually improving sprint velocity or just creating massive review churn.
Implementing ai code reviews requires strict boundaries. You must configure the tool to handle objective rules while reserving subjective architectural decisions for human engineers. If you fail to set these boundaries, the AI will argue with your developers over code formatting and stylistic preferences.
This friction causes massive review churn and slows down your entire pipeline. You must structure the workflow to prevent this noise.
You must map exactly where the AI intervenes in your Software Development Lifecycle. The AI should run its analysis immediately upon pull request creation. It scans for syntax errors, basic code smells, and formatting violations.
The developer resolves these objective flags before a human reviewer is ever assigned to the pull requests. This sequence ensures your senior engineers only spend their time reviewing complex logic and system architecture.
You must train your AI tools using custom rule files specific to your repository. This step prevents the AI from suggesting changes that violate your internal business logic constraints. You can configure the tool to enforce DRY principles and flag code duplication automatically.
The interaction between these custom rule files, the model's context windows, and your code repositories determines the success of the tool. A well-configured rule file reduces false positives and ensures the AI only surfaces actionable insights.
You can't manage what you don't accurately measure. Relying on basic productivity metrics like lines of code written will mislead your leadership team. According to the 2023 DORA Report, true delivery predictability matters far more to business outcomes than raw development speed. You must measure if your ai code review tools are actually accelerating delivery or just shifting the bottleneck.
TargetBoard provides this critical measurement layer. It tracks the difference between AI-generated output and human review times. If an AI tool increases output by 40 percent but causes pull requests to sit in review for three extra days, your actual sprint velocity decreases. TargetBoard exposes these hidden workflow bottlenecks, so you can adjust your strategy based on objective operational intelligence rather than intuition.
The primary value of an AI code review tool is workflow efficiency, not replacing human architectural judgment. These tools are highly effective at clearing out boilerplate errors and enforcing basic code quality. Yet they introduce their own hidden complexities that require continuous systemic measurement.
According to 2024 GitHub Copilot research, AI assistants boost developer productivity by up to 55 percent. You must balance that speed with strict oversight to protect codebase maintainability and prevent the accumulation of technical debt. By running an operational intelligence layer alongside your AI tools, you can safely accelerate software delivery while maintaining complete confidence in your engineering metrics.

.webp)