.png)
Problem: Teams often prioritize short-term deadlines over sustainable software architecture to meet immediate market demands. This creates hidden structural compromises within the codebase.
Solution: Engineering leaders must treat this deferred maintenance as a measurable business liability that directly impacts engineering velocity and resource allocation.
Software developer Ward Cunningham coined the financial analogy of technical debt to explain this dynamic. Borrowing time to release faster is a perfectly acceptable business strategy, but you incur interest on that loan.
You must pay down the principal through regular software maintenance. If you fail to do this, the compounding interest eventually paralyzes the engineering team. Every new feature requires modifying fragile code, so the cost of future changes becomes prohibitively expensive.
Unmanaged debt inevitably causes critical missed delivery targets. A VP of Engineering might commit to a Q3 product launch based on current team capacity. But technical drag from a legacy billing module quickly causes endless pull request churn.
Developer productivity plummets as engineers spend weeks untangling fragile logic instead of building new capabilities. The result is severe system instability and missed business outcomes. Slower feature releases give competitors the advantage and directly impact revenue pacing.
Engineering leaders categorize tech debt by analyzing the intent behind the decision and the context in which it occurs. This framework helps teams distinguish between strategic technical tradeoffs and simple carelessness.
This occurs when a team explicitly knows the right way to build a feature but chooses the wrong way just to meet short-term deadlines. They might hardcode values or skip essential automated testing entirely.
The team makes these technical tradeoffs without any plan to fix the underlying issues later. This behavior signals a toxic engineering culture and guarantees future delivery failures.
Strategic leaders use this category as a calculated business lever. A team might choose a monolithic architecture over microservices to test a minimum viable product and accelerate time-to-market.
The leadership team understands the limitations and actively schedules future sprints to pay down the debt once the product proves its value. This approach aligns engineering efficiency directly with positive business outcomes.
This debt accumulates when teams simply don't know any better. A junior engineering team might build a complex feature without understanding the design patterns required to scale it.
The resulting code is sloppy and introduces massive operational overhead. Leaders must address this through better training, stricter review processes, and improved engineering efficiency standards.
Even the most talented teams accumulate this debt over time. You might build a brilliant system using the best available practices, but industry standards evolve and user demands shift two years later.
The original design no longer fits the current reality. This impacts codebase health and turns previously modern applications into legacy systems. The result is rising pull request churn as engineers struggle to adapt the old code to new requirements.
The rapid adoption of AI coding assistants fundamentally changes how organizations accumulate risk. AI tools allow developers to generate thousands of lines of code in seconds, so this massive spike in output creates a severe bottleneck downstream.
Human reviewers can't match the pace of the machine. AI doesn't necessarily write bad code, but it dramatically increases code complexity. Developers often accept AI suggestions without fully understanding the underlying logic, and this introduces hidden vulnerabilities.
This dynamic forces human reviewers to spend days deciphering convoluted pull requests. The operational overhead skyrockets, and codebase health deteriorates rapidly. You can't solve this modern friction with legacy metrics.
Engineering leaders can't fix every imperfect line of code. You must treat technical debt reduction as an ongoing resource allocation exercise. According to a 2022 McKinsey report, developers spend approximately 30% of their time managing technical debt1. A 2018 Stripe Developer Coefficient study found that engineers lose up to 17 hours a week to software maintenance and bad code2.
You can't afford that level of waste, so you need a systematic approach to identify which infrastructure debt actually threatens your business. Use this step-by-step guide to evaluate and prioritize your refactoring efforts:
You might track a drop in sprint velocity, but that metric alone doesn't reveal the root cause of the slowdown. A common leadership mistake is tracking metrics without contextualizing the underlying workflow bottlenecks.
A single complex pull request can cause severe code review delays, which blocks multiple engineers and creates a cascading delay across cross-team dependencies. You must perform a root cause analysis to understand exactly where the friction lives. Connecting code complexity directly to cycle time delays gives you the objective data needed to prioritize fixes before they derail your release schedule.
Engineering leaders struggle to justify debt to non-technical stakeholders because they lack objective data connecting code quality to business outcomes. Fragmented data across Jira and GitHub erodes trust in the boardroom. You are left relying on intuition rather than concrete signals to defend your resource allocation.
Standard frameworks and Agile methodologies provide signals of a slowdown, but they don't provide an understanding of the underlying causes when operating at scale. To properly evaluate operational friction and justify refactoring, leaders must implement an operational intelligence layer.
TargetBoard is an agentic operational intelligence platform that helps leadership teams understand how execution is performing, why it is changing, and how to respond. It connects data across company systems, interprets performance through operational intelligence, and uses domain-expert AI agents to guide execution decisions.
Everyone who touches the product lifecycle shares responsibility for it. Product managers create debt when they push unrealistic deadlines without consulting engineering constraints. Developers create it when they skip technical documentation or ignore established coding standards.
Leadership ultimately owns the debt because they control the culture and the budget. You must foster an environment where engineering efficiency balances perfectly with speed to market. When you treat debt as a shared business reality, teams can openly discuss tradeoffs without fear of blame.
You can't walk into a board meeting and ask for a month to clean up bad code. You must frame the initiative around risk mitigation and delivery tradeoffs. Follow this step-by-step guide to build a compelling executive case:
Understanding these patterns gives you a clear framework for your next resource planning session. You no longer have to wait for a major outage to address technical entropy. You can monitor codebase health continuously and catch bit rot before it impacts your customers.
Start by auditing your current reporting systems to see if they actually explain why performance is changing. Move away from manual data aggregation and implement an intelligence layer that connects code complexity to delivery outcomes. This shift allows you to stop reacting to delayed releases and start driving predictable execution across your entire engineering organization.
.png)
Code churn refers to the percentage of a developer's code that gets rewritten, modified, or deleted shortly after being written. Teams typically measure this within a strict 3-week timeframe. If an engineer writes a function and rewrites it two days later, that action is code churn.
When you ask what is code churn, the answer lies in your version control systems. These systems track the exact lines added, modified, and deleted before code reaches production. High churn over a short period indicates that the code was not stable upon its first commit.
You calculate churn code by dividing the number of lines modified or deleted within a specific period by the total number of lines added during that same period. You then multiply the result by 100 to get a percentage.
Here is how you calculate code rework step by step:
Keep in mind that commit frequency alone doesn't equal churn. A developer might commit frequently to save progress without rewriting the same lines of code.
Code churn isn't inherently bad. It is a natural part of the software development lifecycle. The goal is not to eliminate it, but to differentiate healthy prototyping from destructive rework.
Healthy churn happens during the initial design phase when engineers iterate on complex problems. Destructive rework happens when developers constantly rewrite code due to unclear requirements or accumulating technical debt. This unhealthy behavior creates workflow bottlenecks that delay delivery.
Consider a scenario where a team is updating an aging payment gateway. Working with legacy code naturally requires trial-and-error coding. A developer submits a pull request, and the reviewer requests multiple architectural changes because the original product requirements were vague.
The developer spends the next four days rewriting the same 500 lines of code. This is review churn. It isn't a developer defect, but a systemic issue caused by poorly defined upstream requirements. The engineering effort is wasted, so the entire sprint slows down.
A 5% churn rate is exceptionally low and generally indicates a highly stable, well-understood codebase. Industry research from LinearB1 suggests that a healthy churn threshold sits around 20% for most engineering teams. Appfire2 confirms that exceeding this limit often points to systemic process failures rather than individual coding errors.
But a single baseline doesn't apply universally. A team building a new product from scratch will naturally see higher churn than a team maintaining an established application. You must establish a baseline based on historical engineering metrics for each specific project. If a team's baseline is 15% and it suddenly spikes to 40%, you have a clear signal that sprint velocity is about to drop.
A sudden spike in code rework is a symptom of a deeper operational failure. You must perform a root cause analysis to understand why engineers are rewriting their work. If you ignore the underlying issues, you will see an increase in software bugs and a massive slowdown in cycle time.
Common drivers of destructive rework include:
Last quarter, a core delivery team saw their pull request review churn spike by 40%. The dashboard highlighted the developers as the problem, but the real issue was shifting requirements from product management. The developers were building features based on vague tickets.
When reviewers finally saw the code, they requested massive architectural changes to align with the actual business goals. These communication breakdowns force developers to rewrite working code. This constant rework inevitably leads to developer burnout and severely damages your overall delivery predictability.
Engineers sometimes dive into a problem without a clear architectural plan. This trial-and-error coding results in massive rewrites before the code even reaches the review stage. The issue often stems from failing to apply SOLID design principles early in the process.
When code complexity is high, every new addition breaks existing functionality. Developers have to constantly rewrite their logic to force the new code to fit. You can fix this by enforcing technical design documents before any coding begins.
Avoid using code churn as an individual performance punishment tool because high churn is a systemic workflow diagnostic rather than a developer defect.
You can identify these bottlenecks by tracking your workflow behavior through these steps:
Generative AI is fundamentally altering how software is built. AI coding tools increase raw output, but they often severely bog down review cycles. Developers can generate hundreds of lines of AI-generated code in seconds. This creates an illusion of high productivity.
But this code often contains hidden complexity and massive code duplication. Reviewers have to spend hours untangling the logic, and they frequently force the original developer to rewrite the entire section. This drives up your review churn and creates a massive bottleneck.
Industry frameworks like DORA metrics are excellent tools for measuring engineering performance. They provide valuable signals about speed and reliability. But these metrics only tell you that your cycle time dropped or your defect rate increased. They don't tell you why the change happened.
To manage the influx of AI-generated code and protect your delivery predictability, you need more than passive reporting. You need an operational intelligence layer that connects codebase health directly to delivery risk.
TargetBoard is an agentic operational intelligence platform that helps leadership teams understand how execution is performing, why it is changing, and how to respond. It connects data across company systems, interprets performance through operational intelligence, and uses domain-expert AI agents to guide execution decisions.
This continuous intelligence allows you to differentiate between human-written and AI-generated code churn. You catch delivery risk before it gets merged, ensuring your execution stays aligned with your planning.
You can't improve what you don't understand. When you reduce destructive rework, you directly improve your delivery predictability. Teams stop wasting engineering effort on endless review cycles and start shipping reliable features on time.
You must stop treating engineering metrics as a retroactive scorecard. Delivery failures are system issues rather than developer defects. You need to use operational intelligence to catch workflow bottlenecks in real time. This approach restores trust in your reporting and gives you the confidence to allocate resources effectively.
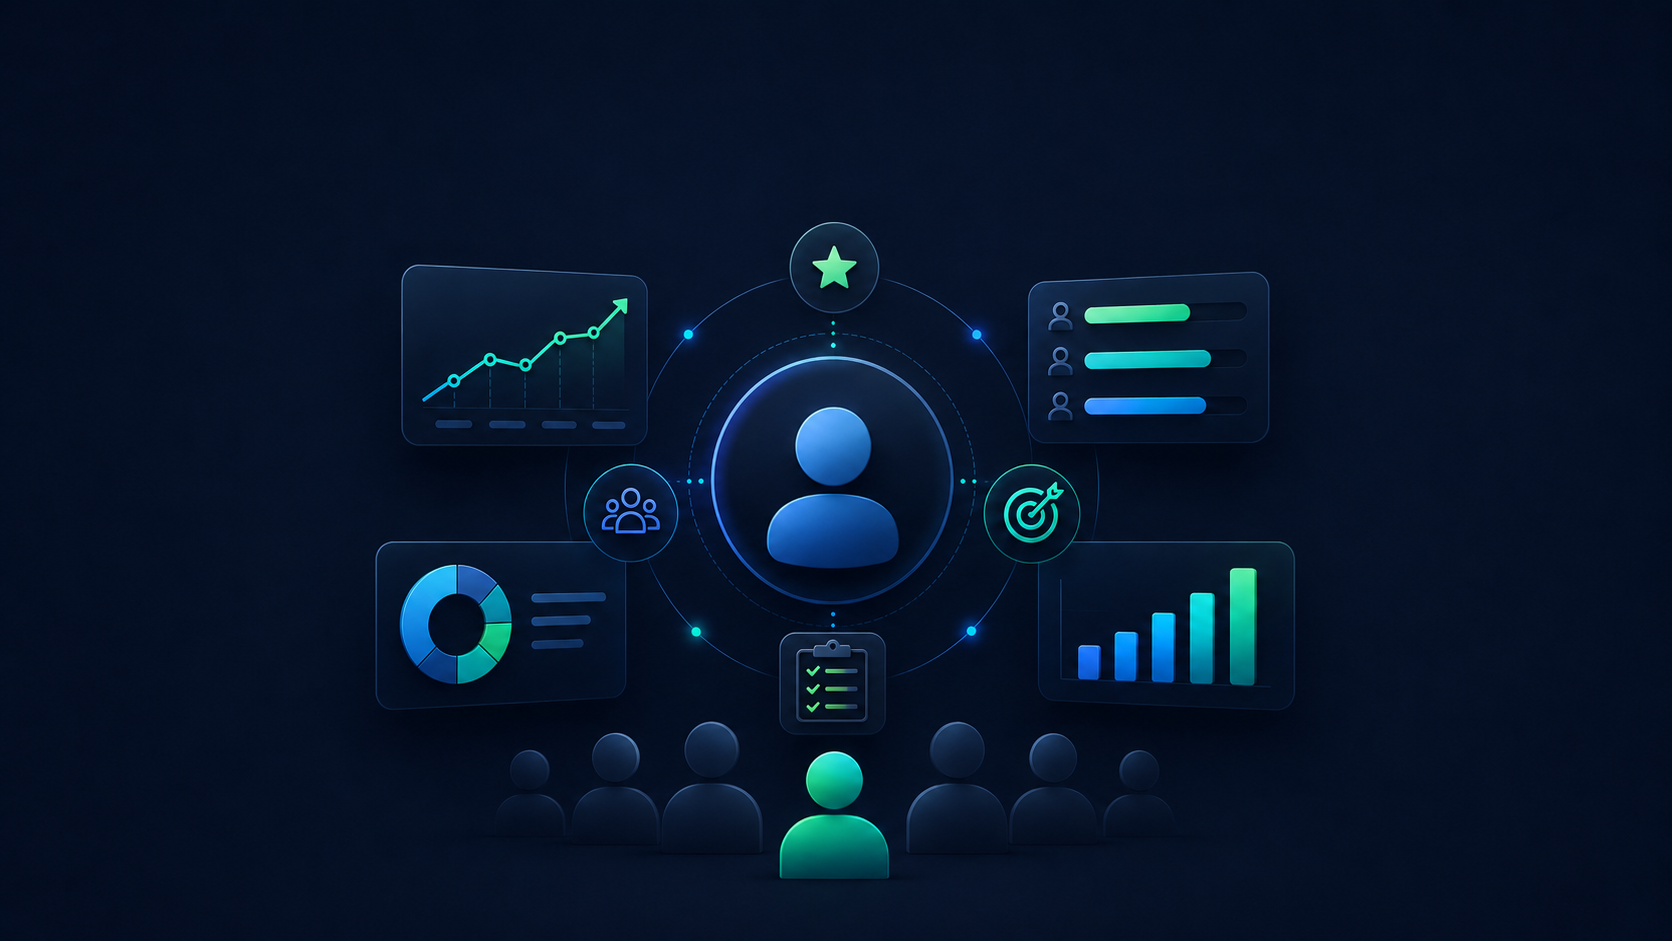
Employee performance management in modern engineering is the continuous process of aligning software delivery systems to business goals by identifying and removing workflow bottlenecks. It shifts the leadership focus away from isolated developer output and toward systemic execution alignment.
The traditional performance management process relies on individual appraisals, subjective feedback, and isolated activity metrics like lines of code. This outdated approach assumes that maximizing individual effort will automatically result in faster delivery.
The modern engineering approach recognizes that software development is a highly collaborative system. An individual developer might produce code rapidly, but that code can sit in a review queue for days due to complex architecture or cross-team dependencies. Modern performance management measures these systemic workflows to explain why delivery slows down and how leaders can restore predictability.
The standard human resources performance management cycle involves five distinct phases: planning, monitoring, developing, rating, and rewarding. Traditional corporate departments use this continuous feedback loop to evaluate staff and conduct traditional performance reviews.
This framework completely breaks down in agile software development. Tracking individual output ignores the reality of cross-team coordination and hidden technical debt. Software delivery is a complex system, so you can't fix a systemic bottleneck by rating a single developer's isolated metrics.
Modern engineering organizations replace this outdated cycle with an execution alignment model. This updated approach focuses on objective data signals and operational intelligence to drive better delivery decisions.
You know the frustration of unpredictable delivery. You sit in leadership meetings drowning in data silos across Jira and GitHub, yet you still can't explain exactly why velocity is dropping. The immediate instinct is to buy employee monitoring software to see what developers are doing all day. That approach destroys morale and completely misses the mark.
Visibility is no longer the problem, so you need to focus on true understanding. To manage performance effectively, you must stop asking who is working and start identifying where the work is actually stuck. TargetBoard is an agentic operational intelligence platform that helps leadership teams understand how execution is performing, why it's changing, and how to respond.
It acts as the connective tissue that translates fragmented decision-making signals into clear execution priorities without relying on toxic employee surveillance.
CEOs and board members often ask about the top employee performance metrics to track, but tracking individual KPIs like lines of code creates a toxic culture and incentivizes the wrong behaviors. Research indicates that strict individual productivity monitoring actively degrades team morale and reduces overall output by creating environments of low trust.
Studies on agile environments confirm that evaluating a complex system by isolating a single contributor consistently fails to improve delivery speeds². Instead, you need to track systemic workflow key performance indicators that actually impact delivery predictability.
Artificial intelligence is fundamentally changing how work is produced. I recently worked with an engineering organization that rolled out AI coding assistants across their teams. Within a month, their raw code output spiked dramatically. The leadership team initially celebrated this increase in volume, yet their actual delivery timelines quickly ground to a halt.
The problem was a massive bottleneck in the code review phase. The teams were generating code faster than human reviewers could safely validate it. This created a surge in pull request complexity and introduced hidden technical debt into the codebase.
You can't solve this artificial intelligence impact by telling reviewers to work faster. You have to use a systemic performance approach to manage this new complexity gap, ensuring that increased output does not destroy downstream predictability.
Standard measurement frameworks like DORA and SPACE are highly popular in modern engineering. These frameworks provide useful signals about software delivery performance, but they do not provide true operational understanding. A dashboard might show you that your lead time is increasing, yet it will not tell you why that delay is happening or how to fix it.
Metrics without context actively erode engineering team trust. When leaders see numbers shift but can't explain the cause, they make poor decisions based on assumptions.
To find the actual root cause analysis, you must map workflow friction across your systems visually. You might discover that a drop in velocity is not a developer productivity issue, but a cross-team coordination breakdown blocking a critical path.
Engineering leaders face intense pressure to justify their budgets to the board. When you rely on outdated performance appraisals and individual tracking, you can't confidently explain how engineering effort translates into business value. You end up with a frustrated team and skeptical executives.
Transitioning away from individual surveillance and toward systemic execution alignment is the only sustainable way to build operational trust. This shift provides the objective data signals and real-time operational visibility required to empower your teams. When you focus on removing blockers and optimizing workflows, you restore delivery predictability and clearly demonstrate your engineering return on investment.

.webp)