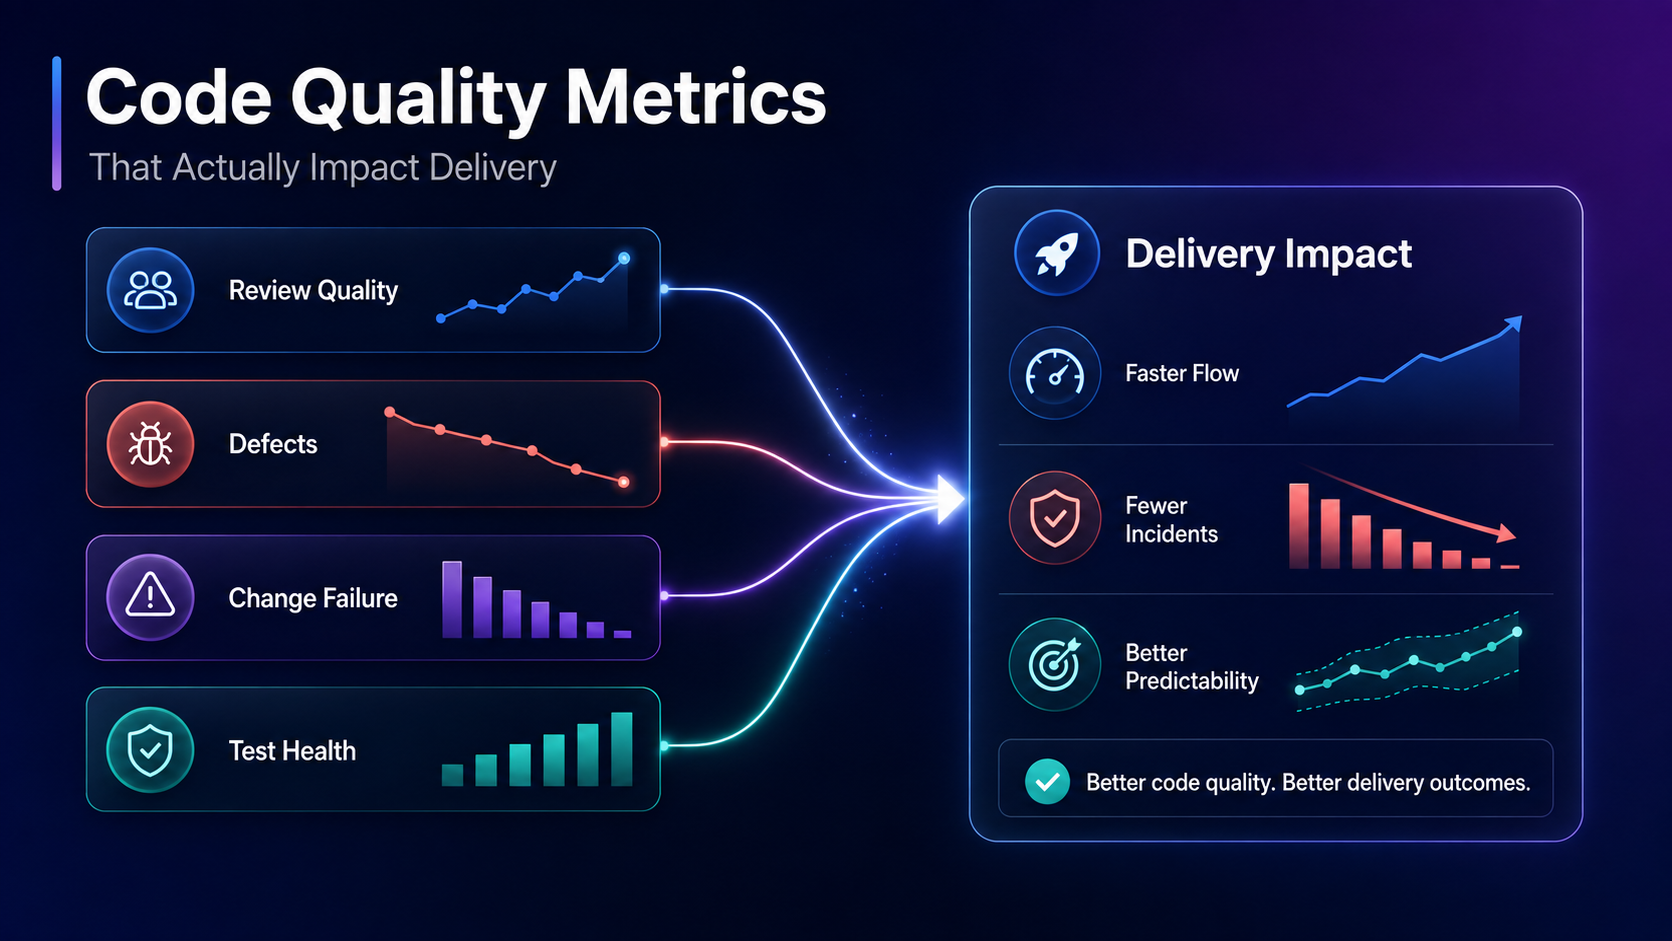
Code quality metrics are quantitative and qualitative measures used to evaluate the health, maintainability, and reliability of a software codebase.
Engineering leaders often struggle to translate raw data into actionable insights for delivery predictability. These metrics solve this by tracking structural complexity, test reliability, and codebase health over time. They act as objective signals that help you identify execution bottlenecks before they slow down your entire development pipeline.
Relying on a single data source creates blind spots across your engineering organization. To measure code quality effectively, you must implement a hybrid approach. Measuring code quality requires capturing both automated and human-driven software code quality metrics.
Measuring structural complexity helps you understand the long-term cost of your code. High complexity creates a massive maintenance burden, so minor feature updates turn into multi-week refactoring projects. Tracking these indicators allows you to manage technical debt before it halts sustainable development. Identifying code smells early prevents fragile architecture from reaching production.
Leaders often confuse cyclomatic complexity with the maintainability index. Both evaluate structural health, but they serve different operational purposes.
A common executive mistake is confusing high developer output with high organizational productivity. A team might merge thousands of lines of code, but that momentum is an illusion if the work consists of heavy code churn and rework. Code duplication inflates output metrics while injecting hidden complexity into the system.
To diagnose these execution bottlenecks, you must look at workflow behavior using these structured signals:
Testing metrics often give leadership a false sense of security. Code coverage tells you what percentage of your codebase executes during a test suite, but it reveals nothing about test reliability or actual system resilience. You must look beyond raw percentages to ensure pre-release stability.
Tracking defect density and bug rate provides a much clearer picture of production readiness. Vulnerability tracking must also integrate directly into your delivery workflows to catch risks early.
Flaky tests destroy developer trust in your continuous integration pipeline. When tests fail randomly, engineers learn to ignore the alerts, so real defects slip into production. This directly impacts your MTTR (mean time to recovery) and increases your change failure rate. High defect density in specific modules signals deep architectural rot that requires immediate intervention to stabilize the system.
Engineering teams optimize for whatever target you set. Pushing rigid mandates creates perverse incentives where developers engage in metric gaming just to satisfy the dashboard. I have seen teams write tautological tests with useless assertions simply to hit an 80 percent test coverage limit. This turns actionable insights into vanity metrics and generates useless rework.
Isolated codebase health metrics don't guarantee delivery performance. You must connect those static numbers to your delivery workflows to see the complete picture. High structural complexity inevitably causes workflow friction, so developers spend more time deciphering logic than shipping features. Cross-repository dependencies increase the blast radius of every code change. You need system-level visibility to understand how these isolated issues delay your entire delivery pipeline.
The industry relies heavily on the framework established by Google's DORA research to measure system health. These are the core 4 metrics you should track:
These metrics provide valuable baseline data, but they fall short because they act as trailing indicators. They tell you that Lead Time is increasing, yet they fail to explain the root cause. DORA metrics don't measure developer productivity or DevEx directly. They provide a partial signal, so you still need an operational intelligence model to understand exactly why those numbers shift.
Large pull request size is the leading indicator of workflow bottlenecks. Massive code changes require immense cognitive load, so reviewers delay looking at them. This drives up PR friction and destroys your code review velocity.
I have experienced the operational pain of trying to manually reconcile Git data with Jira reports during a delayed release. The Jira board showed tickets actively in review, but the Git data revealed massive review churn and continuous rework. When you can't see this friction in real time, you can't clear the bottlenecks before they derail your sprint.
AI-generated code contributions are fundamentally changing how engineering teams operate. According to GitHub's research on AI developer productivity, AI accelerates developer output by up to 55 percent, but it introduces deep hidden complexity.
Traditional CI/CD pipelines weren't designed to handle this sheer volume of automated code generation. You must evaluate the AI impact on your systems to ensure the speed vs. quality tradeoffs don't cripple your architecture.
Yes, ChatGPT and similar large language models can perform basic static code analysis. They can identify syntax errors, suggest optimizations, and ensure alignment with coding standards. But these automated tools lack system-level context. They execute AI code reviews on isolated functions, yet they can't understand how those changes impact cross-repository dependencies or broader architectural goals.
Managing high-volume AI code requires entirely different guardrails than human-written code. I recently saw a team merge a seemingly minor, AI-generated code change that resulted in massive review churn. The AI optimized a single function, but it introduced hidden complexity that broke three downstream services.
Engineering executives have dashboards full of data from SonarQube, Jira, and Git. But these siloed tools don't explain why delivery is slowing down or what the root cause of the friction actually is. Standard frameworks and code quality measures are just raw signals. The gap in modern engineering is no longer data visibility, but rather contextual understanding and coordinated decision-making capability.
The goal isn't to build a better dashboard. You need an operational intelligence layer to achieve true execution alignment. When quality indicators decline, follow this step-by-step process. First, use unified intelligence to detect cross-system dependencies causing the bottleneck, which allows you to see exactly where work is stalling. Next, allocate senior capacity to reduce the technical debt blocking the critical path so your team can regain momentum. Finally, make confident execution decisions before delivery predictability drops.
This proactive approach creates true execution alignment and a sustainable engineering culture. It shifts your leadership posture from reacting to stale data to driving organizational productivity.
.png)
Software development analytics historically focused on extracting data from repositories and issue trackers to measure developer output. But counting commits or lines of code often leads to measurement theater. Teams start gaming metrics to satisfy basic developer productivity tools, which corrupts the validity of passive dashboards and obscures actual workflow bottlenecks.
Mandating restrictive time-tracking software is a common leadership mistake in these scenarios. Instead, you need zero-overhead system integrations that capture actual work patterns.
The industry is now evolving toward software engineering intelligence (SEI). This approach connects planning data with code and delivery systems to explain the underlying causes of performance shifts. Leaders no longer want to know how many tickets were closed. They want to know why a critical initiative is at risk of missing its target date.
Industry frameworks provide valuable signals but they don't provide complete understanding. According to foundational DevOps Research and Assessment (DORA) reports, tracking metrics like deployment frequency, Mean Time to Restore (MTTR), and Change Failure Rate (CFR) helps evaluate delivery speed and system reliability. The SPACE framework adds necessary context around developer satisfaction and system efficiency.
Yet these standards share a critical limitation. If cycle time suddenly spikes, a DORA dashboard will flag the delay but it won't highlight the specific bloated pull request causing the bottleneck. Metrics alone can't explain why performance changes. They require an intelligence layer to translate those numerical shifts into operational reality.
Legacy engineering analytics tools operate as read-only mirrors of your data silos. They pull isolated numbers from CI/CD pipelines and Git analytics without linking the underlying workflow data. This leaves operations directors manually exporting spreadsheets to reconcile conflicting numbers before every board meeting.
Operational intelligence fundamentally changes this dynamic. It acts as an active layer that interprets performance continuously, offering system-level visibility across your entire toolchain. By unifying cross-system data, operational intelligence translates raw metrics into predictive analytics. This shift allows engineering leaders to perform immediate root cause analysis on delayed initiatives and elevate their strategy toward true value stream intelligence.
Artificial Intelligence coding assistants dramatically increase engineering output, so they fundamentally alter how work flows through a system. This acceleration introduces a severe predictability gap. AI-generated code often looks structurally sound but carries hidden technical debt that manual review processes weren't designed to catch.
Consider a common scenario from Q3 enterprise deployments. A team adopts AI coding assistants like Copilot or Cursor, and their raw output doubles in two weeks. But this surge in volume overwhelms the senior engineers responsible for approvals. Pull request size balloons, which drives up review wait time and creates massive workflow bottlenecks. Under this load, tracking maintainability trends becomes impossible.
The resulting review churn actively breaks standard delivery cycles because cross-team dependencies stall while waiting for code clearance. AI impact can't be managed by simply measuring output. Leaders must measure how this generated code affects the entire delivery system and where it introduces risk before it gets merged.
Transitioning from manual spreadsheet reporting to automated operational intelligence typically transforms how a leadership team operates. You stop arguing over whose Jira export is correct and start making immediate capacity decisions. But getting there requires evaluating software development analytics tools with a clear implementation framework. A poor Build vs. Buy decision here can trap your team in years of maintenance, so you must establish a predictable path to implementation.
Start by mapping where your engineering data currently lives, since fragmented systems hide the root causes of delivery delays. Fragmented data across issue tracking systems and continuous integration pipelines creates blind spots that hide cross-team dependencies, especially in distributed, hybrid work environments.
You need a platform that natively integrates with your existing toolchain without requiring developers to change their daily habits. Zero-overhead system integrations ensure your data remains accurate and comprehensive.
Next, focus on identifying where work actually gets stuck, because massive code blocks easily stall downstream testers. High PR size directly correlates to increased rework and extended review wait time. When a massive code block sits in review for four days, it actively breaks standard delivery cycles by stalling downstream testers and blocking dependent teams.
You can use code review intelligence to monitor these specific workflow bottlenecks before they compound. Catching PR latency early allows you to reallocate resources and maintain steady delivery momentum.
Finally, your engineering metrics must translate into business value. Evaluate tools based on their ability to track your investment profile, because engineering metrics must translate into defensible business value for the board.
According to the Financial Accounting Standards Board (FASB) ASC 350-40 guidelines for internal-use software, accurate capitalization reporting requires precise tracking of engineering hours dedicated to new features versus maintenance. A strong analytics platform automates this business alignment so you can defend your resource allocation and capacity planning with objective data.
Evaluating engineering management platforms requires understanding their specific strengths. While over 50 developer tracking tools exist, the top software development analytics platforms specialize in distinct operational areas.
Jellyfish excels at translating engineering activity into financial metrics. It helps leaders visualize their investment profile across different product initiatives. This visibility supports accurate capitalization reporting and allows executives to prove the ROI of their R&D investment to the broader business.
LinearB focuses heavily on the operational mechanics of software delivery. The platform identifies workflow bottlenecks by tracking review wait time and overall cycle time. It also provides automation features that route pull requests to the appropriate reviewers, helping teams clear code faster.
GetDX approaches engineering performance through the lens of human qualitative data. The platform measures developer experience (DevEx) by surveying engineers about friction points in their daily workflows. This qualitative approach supports sustainable development by highlighting cultural and tooling issues that quantitative metrics might miss.
TargetBoard provides a comprehensive view of engineering performance by analyzing data across five core dimensions: speed, quality, predictability, AI impact, and team health. This balanced approach allows leaders to move beyond basic metrics and gain a deeper understanding of how their teams execute. By correlating technical output with operational stability, TargetBoard helps organizations optimize their delivery while maintaining a healthy, sustainable development culture.
Standard engineering analytics tools provide valuable signals, but they don't explain why those metrics change or what to do about them. Dashboards force leaders to manually interpret data silos and guess the root cause of fluctuating engineering performance. This passive approach breaks down entirely in the modern era because Artificial Intelligence accelerates output and introduces hidden complexity that traditional tools can't parse.
You need a system that actively drives execution. TargetBoard is an agentic operational intelligence platform that connects data across company systems, interprets performance continuously, and deploys domain-expert AI agents to guide execution decisions. It connects fragmented data across Jira and GitHub to provide a single trusted operational model.
By deploying domain-expert AI agents, TargetBoard continuously monitors software engineering intelligence to detect AI impact and hidden complexity from generated code. This translates raw metrics into proactive, decision-ready inputs that secure your delivery predictability before risk ever enters the codebase.
Understanding these data patterns gives you a clear framework for your next resource allocation decision. You can now transition your organization from reacting to stale dashboard metrics to proactively managing engineering performance.
Keep in mind that no single tool guarantees success, so your operational systems must fundamentally align with your internal engineering culture and processes. Start by auditing your current data silos and identifying where code generation tools are introducing hidden review bottlenecks, which ensures your delivery predictability remains stable as velocity scales.
.png)
Cognitive complexity is a software metric that evaluates how difficult it is for a human to read and understand a block of code. It assigns a numerical score based on the presence of structures that interrupt the linear flow of reading. A high score signals that the code is hard to parse.
This directly threatens code maintainability and readability. Developers struggle to understand highly complex modules, so they spend more time deciphering logic than writing new features. This metric prioritizes human-readable code over raw mathematical execution. It helps you pinpoint exactly where subjective review decisions will bottleneck your workflow.
The human brain can only hold a limited amount of information in its working memory. When a developer reads a function, they must mentally track every variable and conditional branch to understand the outcome. Deeply nested logic forces the reader to hold multiple contexts simultaneously.
According to cognitive psychology research on working memory, this spikes their cognitive load. Human-readable code minimizes this mental burden by keeping the execution path as linear as possible. So when you measure how developers perceive information, you are actually measuring how quickly they can safely modify the codebase.
Engineering leaders often confuse these two metrics, yet treating them interchangeably is a common management mistake. Cyclomatic complexity is a strict mathematical measurement of every possible execution path through a program. It counts the number of distinct routes the machine can take.
However, code that is simple for a machine to execute can still be incredibly difficult for a human to read. Cognitive complexity ignores machine paths and focuses entirely on human readability. Understanding cyclomatic vs cognitive complexity is critical for execution predictability because only the latter explains why your team is struggling to review a specific module.
Cognitive complexity is not merely a technical grievance. It is a primary driver of workflow coordination failure. While traditional metrics treat all lines of code as equal, this scoring model exposes the hidden tax that dense, non-linear logic imposes on your delivery pipeline. Every time a developer encounters a break in the linear reading flow, they must pause to mentally map a new branch of logic. This mental mapping consumes time and cognitive energy that should be spent on feature delivery.
When code is structured through deeply nested loops and conditional branches, the difficulty of understanding that code scales exponentially rather than linearly. The operational consequence is a review-system saturation point where senior engineers can no longer verify the safety of a change quickly.
The core friction in engineering organizations often stems from how we penalize or fail to penalize complexity. A flat list of conditional checks is manageable. However, placing those same checks inside a nested loop creates a massive spike in complexity that traditional volume metrics ignore.
Focusing on the mechanics of scoring rules misses the broader strategic point. High complexity scores are leading indicators of delivery trust erosion. When your engineers are trapped in a cycle of deciphering dense logic, they are not building new value.
By monitoring these scores, leadership can identify the specific modules that are driving up the cost of change. Reducing cognitive complexity is not about making code look pretty. It is about lowering the barrier to entry for collaboration and ensuring that coordinated decision-making remains possible even as the system grows. High complexity is a signal that your delivery machine is becoming brittle, and ignoring it is a direct threat to long-term system predictability.
When developers write code quickly, they often build logic sequentially. This habit creates structures that are incredibly difficult to review later. A common example of java cognitive complexity is a single method containing multiple "if" and "else if" blocks nested inside a "while" loop. The machine executes this perfectly, yet a human reviewer must mentally map a massive decision tree just to verify a minor bug fix.
Switch statements and overloaded functions present another common trap. An overloaded function with too many parameters forces the developer to constantly check the signature definition, while a switch statement with twenty cases forces the developer to scroll endlessly to find the relevant logic. Recursive methods also drive up complexity scores because they force the reader to mentally simulate the call stack to understand how the loop eventually terminates.
High complexity doesn't stay contained in your codebase. It leaks directly into your engineering operations and destroys workflow efficiency. When a developer submits a highly complex pull request, the reviewer immediately struggles to understand the logic. This confusion leads to subjective review decisions.
Reviewers leave vague comments, the original author pushes back, and the pull request stalls. This creates a massive pull request (PR) churn. To eliminate these delivery bottlenecks, you need a system that connects code-level metrics to workflow behavior.
The rapid adoption of AI coding assistants fundamentally changes how work is produced. These tools generate massive amounts of code instantly, and this output almost always passes automated unit tests. However, AI models don't optimize for human readability by default.
They often output highly nested, verbose logic. When developers submit this AI-generated code impact without refactoring it, they pass an enormous cognitive burden onto human reviewers. This hidden risk quietly accumulates in your repositories, driving up the long-term codebase cost and slowing down future feature development.
You can't eliminate complexity entirely, but you can systematically reduce it through targeted refactoring techniques. The goal is to flatten the logic so the execution path reads linearly from top to bottom. Implement these steps to clean up high-risk modules.
Refactoring complex code pays immediate operational dividends. When you lower the mental burden required to read a file, developer productivity / DevEx improves dramatically. Engineers spend their time building new features instead of deciphering old logic.
This clarity also accelerates developer onboarding. New hires can read the codebase and start contributing safely in their first week. Most importantly, prioritizing readable code prevents the silent accumulation of technical debt, protecting your team's capacity for future quarters.
Tracking a static complexity score from tools like SonarQube is only the first step. A raw number tells you that a file is hard to read, but it doesn't explain how that file impacts your delivery predictability. To manage risk effectively, engineering operations need system-level visibility.
TargetBoard is an agentic operational intelligence platform that helps leadership teams understand how execution is performing, why it is changing, and how to respond. It connects granular codebase complexity directly to workflow friction and delivery metrics.
TargetBoard uses domain-expert AI agents to flag high-risk pull requests and surface code review intelligence in real time. This means you stop reacting to delayed cycle time reports and start catching hidden risks before they merge into your main branch.
High cognitive complexity is more than a technical debt marker. It is a direct tax on your operational infrastructure. When code becomes unreadable, it triggers a cascade of organizational drag: reviewer cognitive overload, escalating PR churn, and a permanent onboarding drag that stifles workflow scalability.
Ultimately, maintainability economics dictate your delivery speed. If your team cannot reason about the system efficiently, coordinated decision-making collapses. You must treat human readability as a core pillar of your execution flow. Ignoring this hidden operational friction ensures that complexity will paralyze your organization long before the dashboards flag a crisis.

.webp)